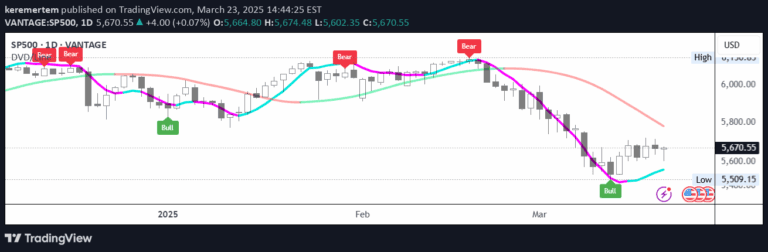
Advanced volume-weighted MACD indicator that combines price action, momentum analysis, and linear regression to detect trend shifts and market strength with precision.
Explore complementary indicator rolesHow it works
The Linear Volume MACD operates by generating volume-weighted exponential moving averages (EMAs) to create MACD and signal lines. It calculates these lines using volume-adjusted price data, which provides a more nuanced momentum perspective compared to traditional MACD indicators.
The indicator offers three distinct analysis modes: Linear Regression, Strong/Weak Trend, and Volume MACD. Each mode provides unique insights by smoothing MACD behavior, identifying trend strength, or spotting potential volume-based divergences. Additionally, dynamic standard deviation bands help traders visualize statistically significant price movements and potential anomalies.
Why it may be useful
Traditional momentum indicators often overlook the critical role of trading volume in confirming price movements. This advanced MACD variant integrates volume analysis directly into its calculations, offering traders a more comprehensive view of market dynamics and trend strength.
By incorporating volume-weighted calculations and multiple analysis modes, the indicator provides deeper insights into market behavior. Traders can leverage its flexible approach to detect subtle trend shifts, assess momentum more accurately, and make more informed trading decisions across different market conditions.
When to explore it
The Linear Volume MACD is most effective in markets with clear trending characteristics and significant volume fluctuations. It excels in identifying potential trend reversals, detecting volatility breakouts, and confirming momentum signals across various financial instruments and timeframes.
Traders should use this indicator in conjunction with other technical analysis tools like price structure, RSI, or market sentiment indicators. Its multi-mode analysis and volume-adjusted approach make it particularly valuable during periods of market transition, helping traders navigate complex price action with greater precision and confidence.
Keep exploring
What we’ve verified
Access, alerts and repainting behaviour have not been independently verified for this indicator. Check the creator’s current publication and settings.
General descriptions and classifications are recovered research. Verified details above identify the specific checks we have completed. Check the creator’s current publication for later changes.