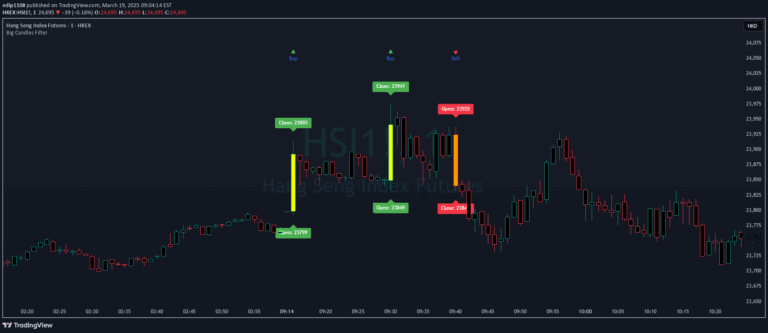
A technical indicator that identifies significant color transitions between red and green candles, signaling potential trend changes based on a customizable percentage threshold.
Explore complementary indicator rolesHow it works
The indicator analyzes consecutive candles by comparing their color and percentage change between opening and closing prices. When a candle transitions from red to green or vice versa and exceeds a predefined percentage threshold, the system generates a specific transition signal.
By tracking these transitions, traders can identify potential momentum shifts and directional changes in the market. The adjustable percentage threshold allows users to customize the sensitivity of the signal, enabling more precise detection of meaningful price movements.
Why it may be useful
This signal helps traders quickly recognize potential trend reversals and significant price movements that might otherwise be overlooked. By providing a clear visual and numerical indication of color transitions, traders can make more informed decisions about market direction and potential entry or exit points.
The customizable threshold adds flexibility, allowing traders to adapt the indicator to different market conditions, asset classes, and trading styles. This adaptability makes the signal a valuable tool for understanding market dynamics and identifying potential trading opportunities.
When to explore it
The indicator is most effective in markets with clear trending characteristics, such as stocks, forex, and cryptocurrencies. It works best during periods of moderate to high volatility, where price movements are more pronounced and transition signals are more reliable.
Traders should use this signal in conjunction with other technical analysis tools to confirm potential trend changes. It is particularly useful for short-term trading strategies like scalping and day trading, where quick identification of market momentum can provide a competitive edge.
Keep exploring
What we’ve verified
Access, alerts and repainting behaviour have not been independently verified for this indicator. Check the creator’s current publication and settings.
General descriptions and classifications are recovered research. Verified details above identify the specific checks we have completed. Check the creator’s current publication for later changes.