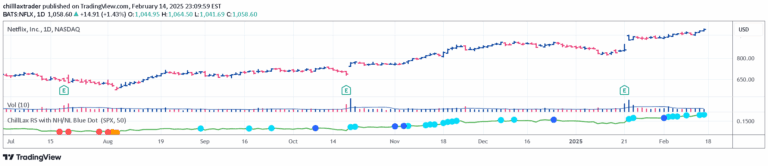
A trading indicator that combines RSI, SuperTrend, and ATR to generate color-coded signals for stock trading, helping traders identify potential entry and exit points.
Explore complementary indicator rolesHow it works
The indicator operates by integrating multiple technical analysis tools to generate trading signals. It first uses the SuperTrend indicator to determine the underlying price trend, identifying whether the market is in an uptrend or downtrend.
Then, it incorporates the Relative Strength Index (RSI) to measure overbought or oversold conditions, while simultaneously using Average True Range (ATR) to assess market volatility. These components are combined to produce color-coded signals: green for potential buy opportunities, red for potential sell signals, and blue for maintaining current positions.
Why it may be useful
This trading signal provides traders with a comprehensive, multi-dimensional approach to market analysis by combining trend, momentum, and volatility indicators. It helps traders make more informed decisions by offering visual cues that synthesize complex market information into easy-to-understand signals.
By integrating different technical indicators, the signal reduces the likelihood of making trades based on a single metric, thereby potentially improving trading accuracy and risk management. The color-coded system allows traders to quickly interpret market conditions and potential trading opportunities.
When to explore it
The indicator is most effective for short-term trading strategies, particularly for intraday and scalping approaches where quick decision-making is crucial. It works best when used in conjunction with other forms of technical and fundamental analysis to confirm trading signals.
Traders should be particularly attentive to this indicator during periods of market volatility or when trading stocks with significant price movements. It is recommended to customize the indicator's settings to align with the specific characteristics of the stock and market being traded.
Keep exploring
What we’ve verified
Access, alerts and repainting behaviour have not been independently verified for this indicator. Check the creator’s current publication and settings.
General descriptions and classifications are recovered research. Verified details above identify the specific checks we have completed. Check the creator’s current publication for later changes.