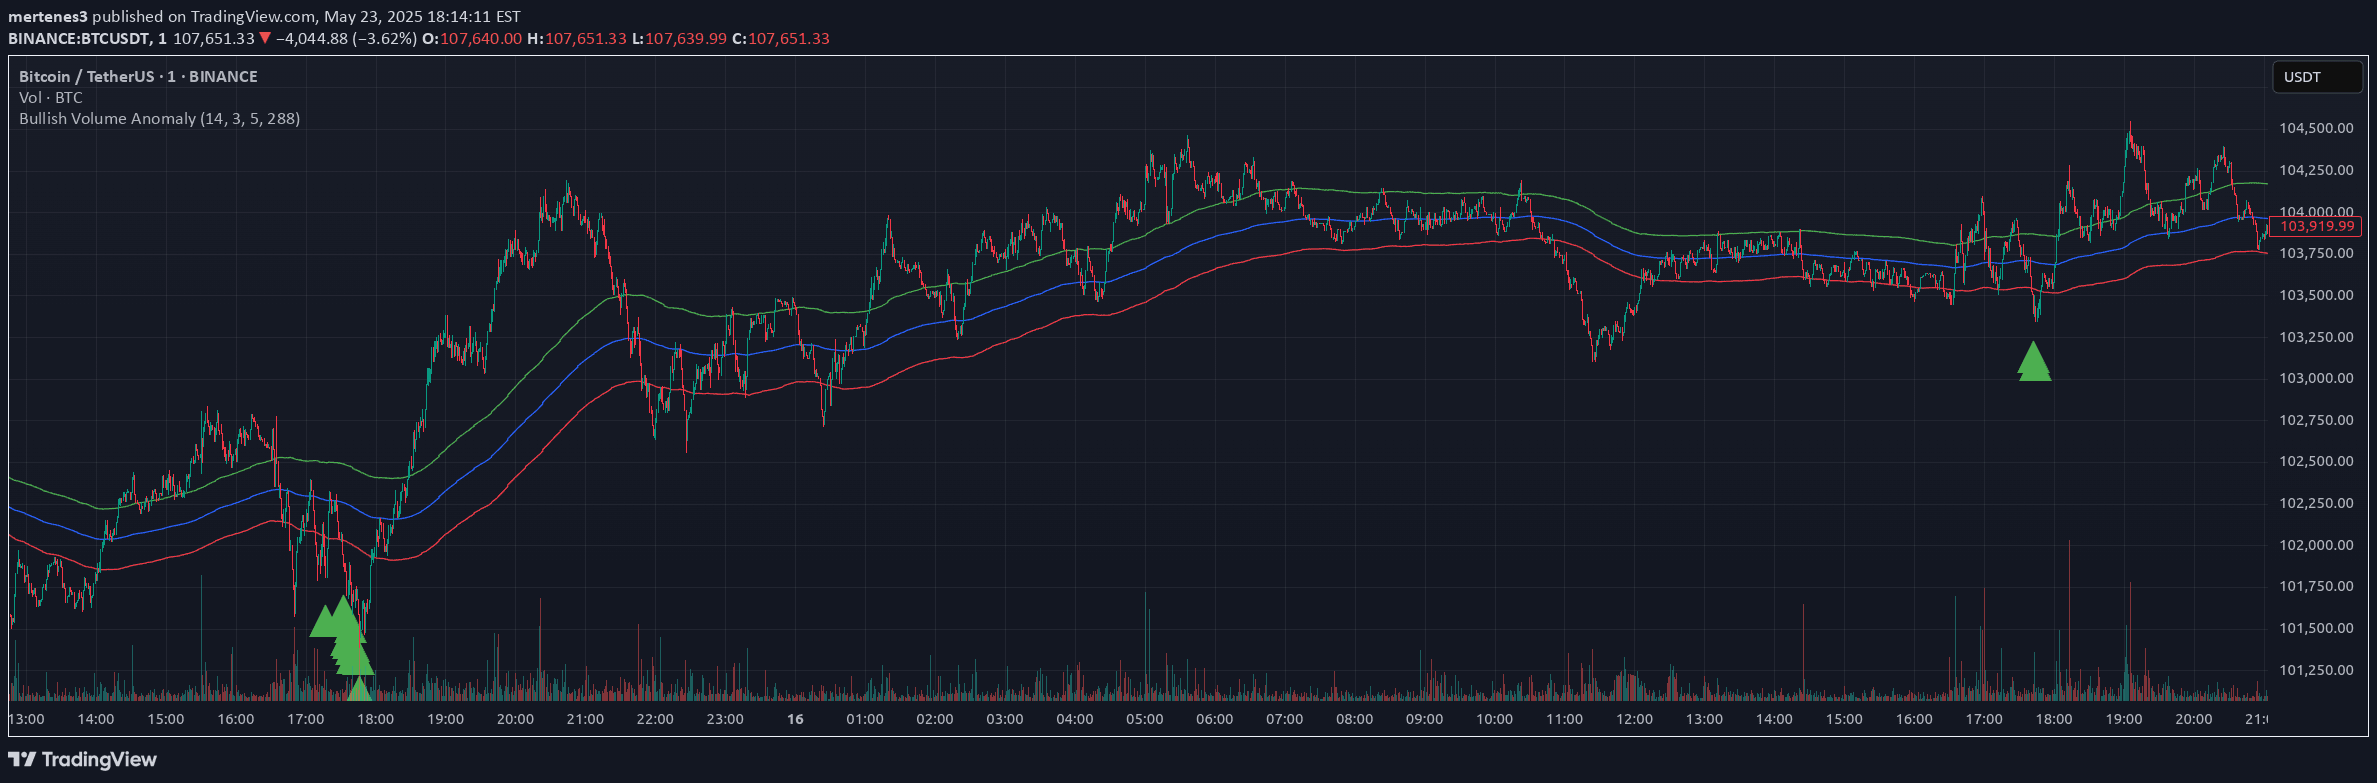
Linear regression predicts stock prices by analyzing the relationship between price and trading volume using a statistical modeling technique that estimates future price movements.
Explore complementary indicator rolesHow it works
Linear regression starts by collecting historical price and volume data over a selected time period, typically 21 days. It plots these data points on a scatter plot with volume on the x-axis and price on the y-axis, creating a visual representation of their relationship.
Using the least squares regression method, the technique fits a straight line that best approximates the data points, representing the linear relationship between volume and price. This line can then be used to estimate potential future prices based on observed trading volumes, providing a statistical forecast of price movement.
Why it may be useful
Linear regression offers traders a quantitative method to understand the potential correlation between trading volume and stock price, providing insights into potential price movements based on statistical analysis. By establishing a mathematical relationship, traders can gain a more objective perspective on market dynamics beyond subjective interpretations.
This approach helps traders develop a systematic strategy for predicting price changes, allowing them to make more informed trading decisions. It transforms complex market data into a simplified model that can highlight potential trends and support risk management strategies.
When to explore it
Linear regression is most effective in markets with relatively stable and predictable volume-price relationships, such as established stocks or less volatile markets. Traders should use this method when they have access to consistent historical data and want to understand potential price movements based on trading volume.
It works best when combined with other technical analysis tools and fundamental research, serving as one component of a comprehensive trading strategy. Traders should be cautious and recognize that while linear regression can provide valuable insights, it cannot account for all market complexities or unexpected external factors.
Keep exploring
What we’ve verified
Access, alerts and repainting behaviour have not been independently verified for this indicator. Check the creator’s current publication and settings.
General descriptions and classifications are recovered research. Verified details above identify the specific checks we have completed. Check the creator’s current publication for later changes.