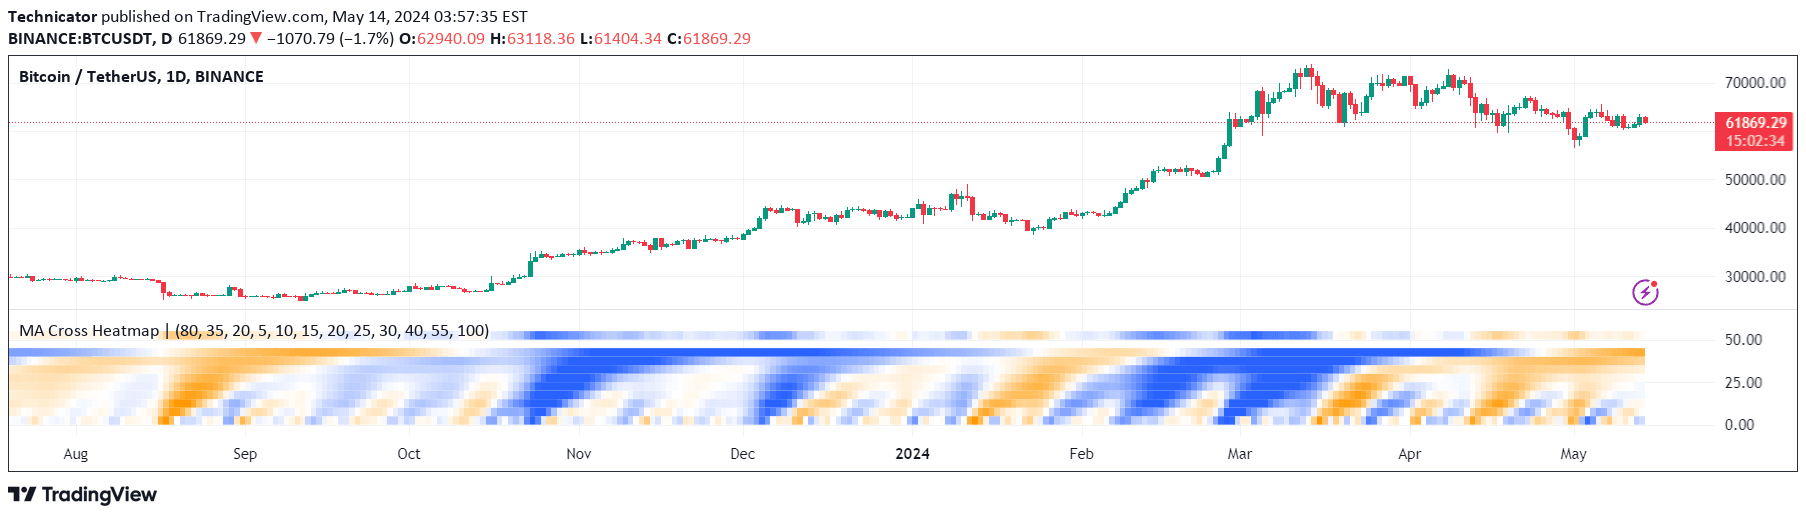
A unique moving average crossover visualization that uses a heat map to display crossing distances between multiple moving averages, helping traders identify potential trend changes and trading opportunities.
Explore complementary indicator rolesHow it works
The Moving Average Cross Heatmap operates by tracking the crossing points between multiple moving averages and representing these interactions through color-coded heat mapping. It calculates the distances and time intervals between different moving average crossovers, creating a visual representation that allows traders to quickly understand complex moving average interactions.
By plotting up to nine different moving averages simultaneously, the indicator generates a dynamic heat map that changes color based on the crossing lengths and relationships between these averages. This approach transforms complex mathematical calculations into an intuitive visual format that makes it easier to detect potential trend shifts and momentum changes.
Why it may be useful
The Moving Average Cross Heatmap provides traders with a sophisticated method of analyzing market trends by transforming complex moving average interactions into an easily digestible visual format. It offers a unique perspective on trend dynamics that goes beyond traditional moving average analysis, allowing traders to quickly identify potential trend changes and momentum shifts.
By presenting crossover information through color-coded heat mapping, the indicator helps traders make more informed decisions by providing a comprehensive view of multiple moving average relationships. This approach reduces the cognitive load of interpreting multiple moving average interactions and enables faster, more intuitive trend analysis.
When to explore it
The Moving Average Cross Heatmap works best in markets with clear trending characteristics, such as forex, stocks, and cryptocurrencies with sufficient volatility and directional movement. Traders should utilize this indicator during periods of consistent market trends, where moving average crossovers can provide meaningful signals about potential trend changes and momentum shifts.
The indicator is particularly valuable when combining multiple timeframes and when traders want to gain a more nuanced understanding of trend dynamics beyond traditional moving average crossover strategies. It is most effective when used in conjunction with other technical analysis tools to confirm signals and provide additional context for trading decisions.
Keep exploring
What we’ve verified
Access, alerts and repainting behaviour have not been independently verified for this indicator. Check the creator’s current publication and settings.
General descriptions and classifications are recovered research. Verified details above identify the specific checks we have completed. Check the creator’s current publication for later changes.