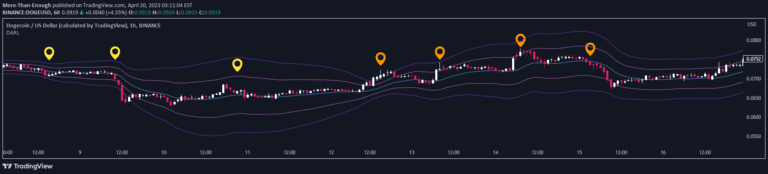
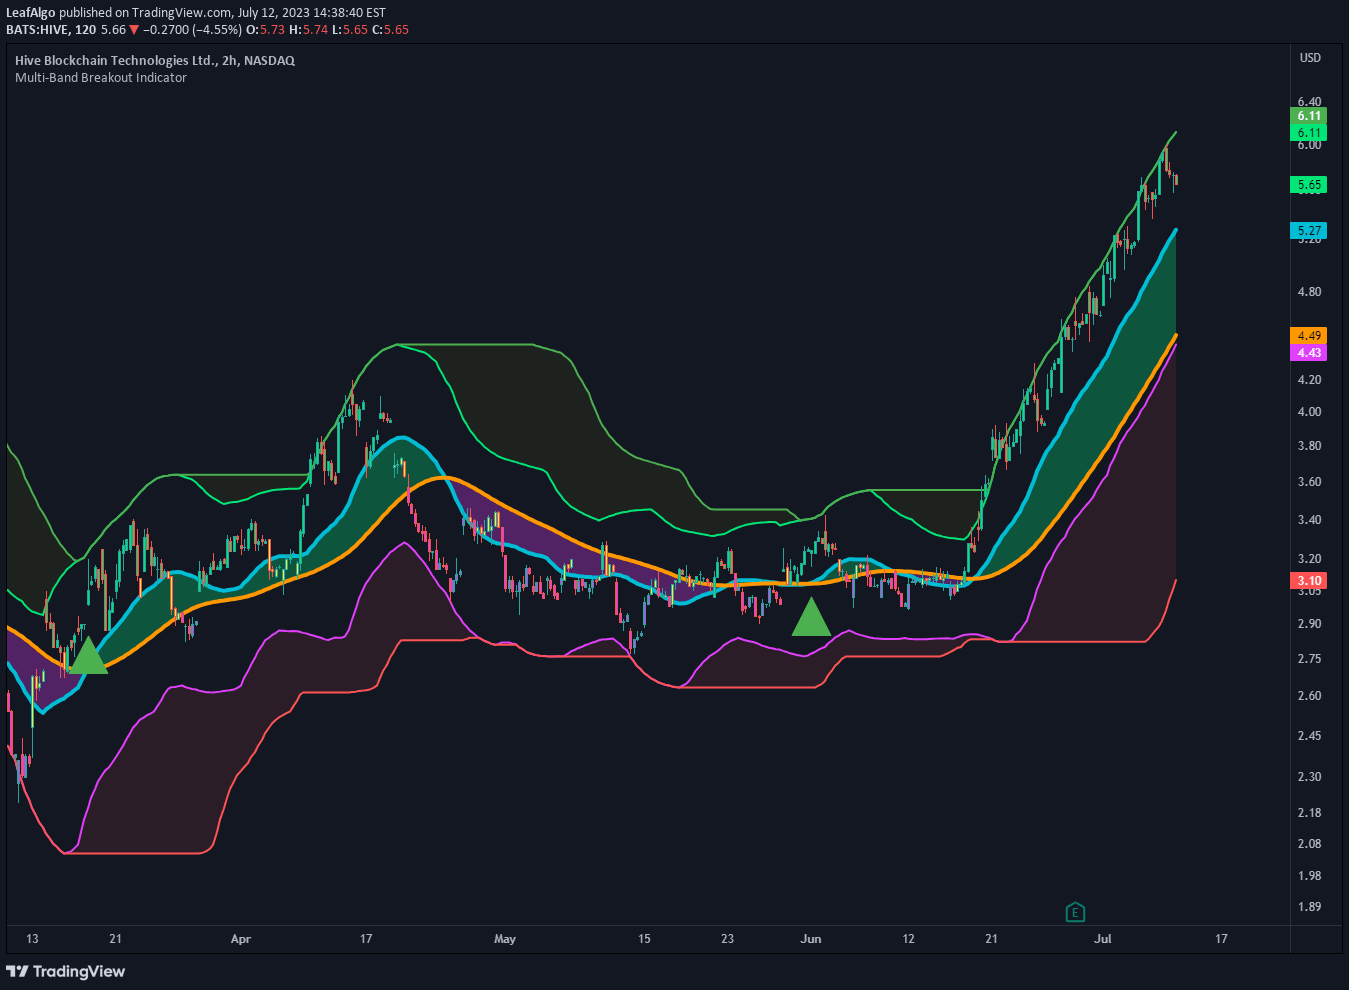
A trading indicator that identifies potential market reversals by analyzing price action extremes and mean reversion using moving average standard deviation bands.
Explore complementary indicator rolesHow it works
The Reversal Candle Mean Reversion Indicator operates by first identifying price action reversal signals through specific candle patterns. For bullish reversals, it looks for a candle that sweeps the prior candle's low and closes higher, while bearish reversals involve a candle sweeping the prior high and closing lower.
The indicator then confirms these signals by checking the price's relationship with moving average standard deviation bands. By using customizable moving average types and standard deviation multipliers, traders can fine-tune the indicator to detect potential mean reversion opportunities across different market conditions.
Why it may be useful
This indicator provides traders with a sophisticated approach to identifying potential market turning points by combining price action analysis with statistical volatility measurement. It helps traders recognize moments when price movements have become excessive and are likely to return to a mean value.
By offering a structured method for detecting reversals, the indicator reduces emotional decision-making and provides a more systematic approach to trading. It allows traders to objectively assess market conditions and potential entry and exit points based on quantitative and visual signals.
When to explore it
The Reversal Candle Mean Reversion Indicator is most effective in markets that exhibit ranging or cyclical behavior, where prices tend to oscillate around a central moving average. It works particularly well in markets with consistent volatility and clear trend cycles, such as forex, futures, and some stock indices.
Traders should preferentially use this indicator in timeframes that allow for clear price action patterns, typically ranging from 5-minute to daily charts. It is especially useful during periods of market consolidation or when prices have moved significantly away from their average values, signaling potential mean reversion opportunities.
Keep exploring
What we’ve verified
Access, alerts and repainting behaviour have not been independently verified for this indicator. Check the creator’s current publication and settings.
General descriptions and classifications are recovered research. Verified details above identify the specific checks we have completed. Check the creator’s current publication for later changes.