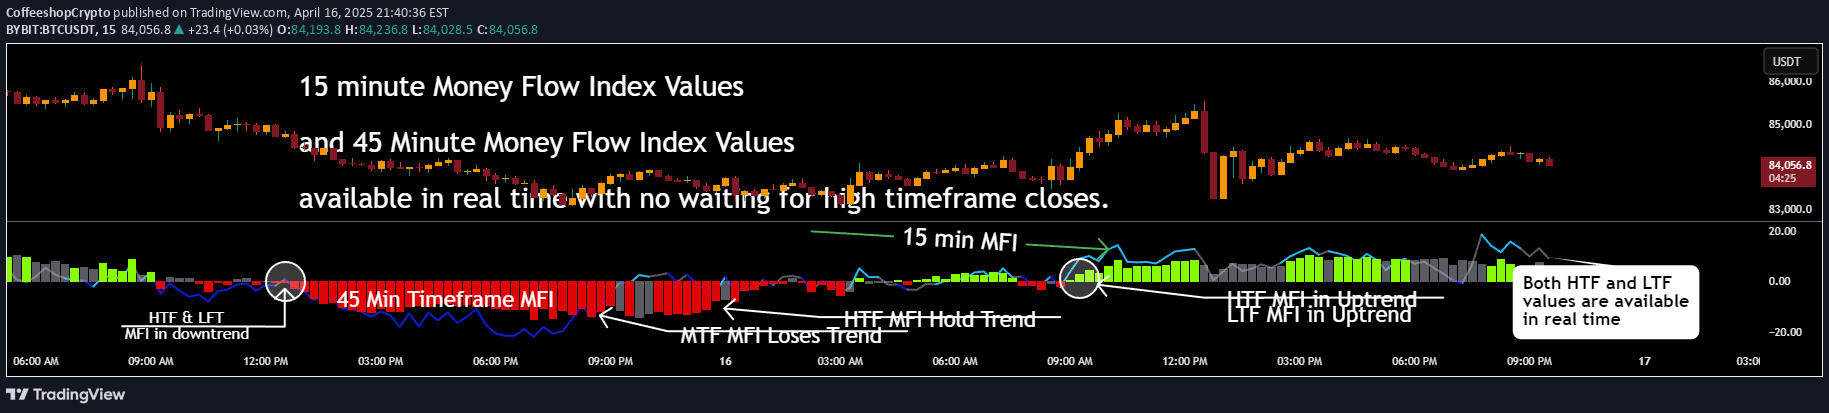
The Money Flow Index (MFI) tracks buying and selling pressure by combining price and volume data, helping traders identify potential overbought or oversold market conditions.
Explore complementary indicator rolesHow it works
The Money Flow Index calculates market momentum by analyzing both price and trading volume over a specified look-back period, typically 14 bars. It generates a value between 0 and 100, with readings above 80 indicating overbought conditions and below 20 suggesting oversold scenarios.
The indicator dynamically adjusts candle opacity based on the MFI reading, providing a visual representation of market momentum. When the MFI is near 100, candles become more opaque, signaling strong buying pressure, while values near 0 result in more transparent candles, indicating weak market activity.
Why it may be useful
The Money Flow Index offers traders a comprehensive view of market dynamics by integrating both price movement and trading volume into a single indicator. This approach provides deeper insights than price-only momentum oscillators, allowing traders to understand the strength behind price changes and potential trend reversals.
By highlighting overbought and oversold conditions with visual labels and adjustable candle opacity, the MFI helps traders make more informed decisions about potential entry and exit points, risk management, and market sentiment.
When to explore it
The Money Flow Index is most effective in markets with clear trending or ranging conditions, where volume plays a significant role in price movement. Traders can use it to identify potential reversal points, confirm trend strength, and assess market momentum across different timeframes.
It works particularly well when combined with other technical analysis tools, helping traders validate signals and reduce false positives. The multi-timeframe capability allows for comparing money flow trends across different chart resolutions, providing a more comprehensive market analysis.
Keep exploring
What we’ve verified
Access, alerts and repainting behaviour have not been independently verified for this indicator. Check the creator’s current publication and settings.
General descriptions and classifications are recovered research. Verified details above identify the specific checks we have completed. Check the creator’s current publication for later changes.