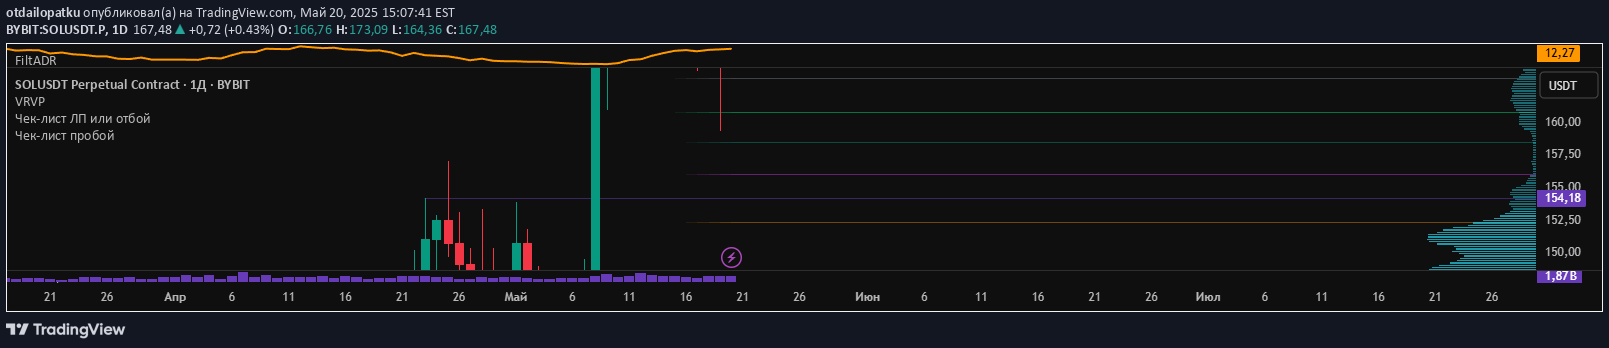
A multi-timeframe ATR indicator that displays Average True Range values across different time periods, helping traders assess market volatility and potential price movements.
Explore complementary indicator rolesHow it works
The Multi-Timeframe ATR Indicator calculates the Average True Range across multiple timeframes including 1-hour, 3-hour, 4-hour, 1-day, and 2-day periods. It computes the ATR by measuring the maximum of three price ranges: current high minus low, absolute value of current high minus previous close, and absolute value of current low minus previous close.
The indicator then plots these ATR values on the chart, allowing traders to visually compare volatility across different time periods. Each timeframe can be individually toggled on or off, and the plots are color-coded for easy interpretation and customization.
Why it may be useful
Understanding market volatility is crucial for traders as it helps in assessing potential price movements and managing risk effectively. The multi-timeframe approach provides a comprehensive view of market volatility, allowing traders to make more informed decisions about trade entry, exit, and position sizing.
By presenting ATR values across different timeframes, the indicator helps traders understand how volatility changes and potentially correlates across various trading periods. This insight can improve risk management strategies and help traders adapt their approach based on current market conditions.
When to explore it
The Multi-Timeframe ATR Indicator is most valuable during periods of significant market uncertainty or when traders want to compare volatility across different time horizons. It is particularly useful when analyzing markets with potentially changing volatility conditions, such as during economic announcements or major market events.
Traders can use this indicator when they need to assess potential price range and volatility before entering a trade, helping them set more accurate stop-loss and take-profit levels. It is especially beneficial for traders who want to understand market dynamics beyond a single timeframe and incorporate volatility insights into their technical analysis.
Keep exploring
What we’ve verified
Access, alerts and repainting behaviour have not been independently verified for this indicator. Check the creator’s current publication and settings.
General descriptions and classifications are recovered research. Verified details above identify the specific checks we have completed. Check the creator’s current publication for later changes.