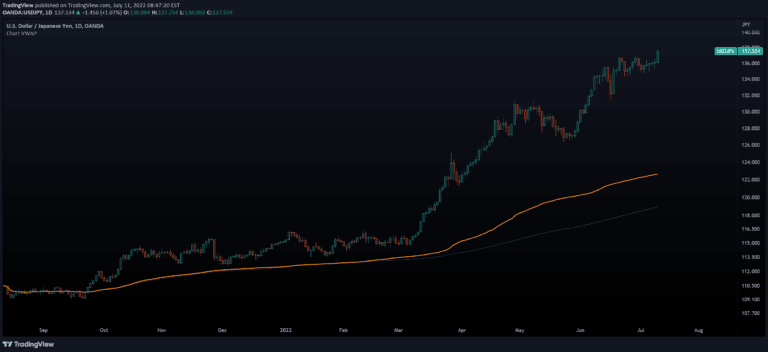
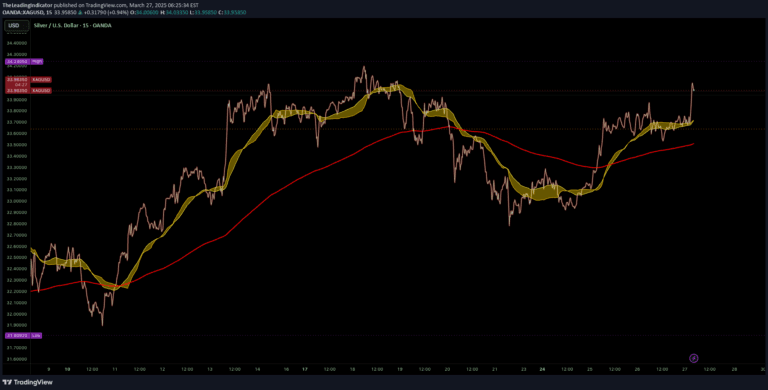
A multi-timeframe Volume Weighted Moving Average (VWMA) indicator that tracks price action across eight different timeframes, providing trend insights through visual and tabular analysis.
Explore complementary indicator rolesHow it works
The Multi-Timeframe VWMA Indicator operates by calculating a Volume Weighted Moving Average (VWMA) that considers both price and trading volume across multiple timeframes. It plots the VWMA directly on the current chart, using customizable parameters like price source, length, color, and offset to adapt to different trading styles and preferences.
The indicator simultaneously generates a comprehensive table that displays the relationship between the selected price source and VWMA across eight distinct timeframes, ranging from 1-minute to 1-week intervals. Using request.security, it efficiently fetches and compares data, presenting visual indicators like green upward arrows for bullish momentum and red downward arrows for bearish pressure.
Why it may be useful
The Multi-Timeframe VWMA Indicator provides traders with a powerful, holistic view of market trends by integrating volume-weighted analysis across multiple timeframes. By considering both price and volume, it offers more nuanced insights than traditional moving averages, helping traders understand the strength and direction of price movements more comprehensively.
Its unique multi-timeframe approach allows traders to simultaneously assess short-term and long-term market dynamics, reducing the risk of making decisions based on limited timeframe perspectives. The customizable nature of the indicator, with adjustable parameters and clear visual representations, empowers traders to tailor their analysis to specific trading strategies and market conditions.
When to explore it
The Multi-Timeframe VWMA Indicator is most effective for traders seeking a comprehensive, volume-weighted trend analysis tool that provides insights across different market timeframes. It is particularly useful during periods of market volatility, where understanding trend strength and volume dynamics can help make more informed trading decisions.
Traders can leverage this indicator in various market conditions, especially when transitioning between different trading sessions or analyzing potential trend reversals. Its versatility makes it valuable for scalpers and day traders who require quick, multi-timeframe insights, though it may be less suitable for long-term swing trading strategies that demand more extended trend analysis.
Keep exploring
What we’ve verified
Access, alerts and repainting behaviour have not been independently verified for this indicator. Check the creator’s current publication and settings.
General descriptions and classifications are recovered research. Verified details above identify the specific checks we have completed. Check the creator’s current publication for later changes.