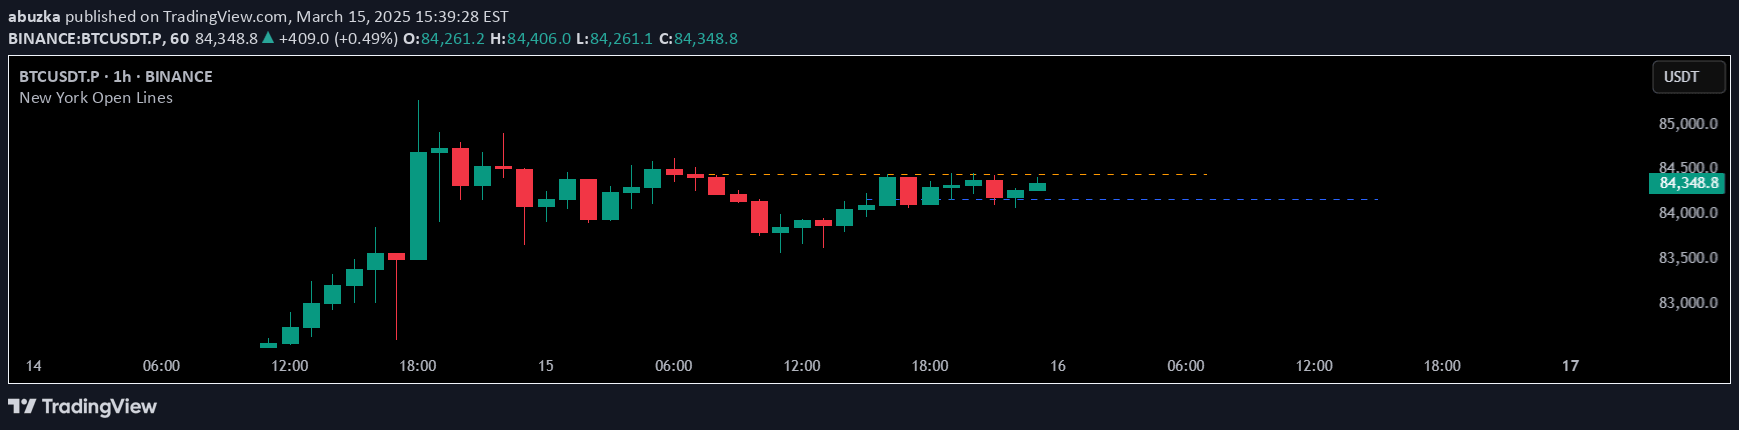
NZTInstitutionalLevel is a TradingView indicator that calculates and displays significant institutional price levels, helping traders identify potential market entry and exit points.
Explore complementary indicator rolesHow it works
The indicator analyzes historical price data to identify significant institutional levels by examining support and resistance zones where large market participants typically trade. It calculates these levels based on current asset price, market volatility, and selected time intervals, adapting the level step size dynamically.
The script automatically scales the number of displayed levels depending on the timeframe, ensuring traders focus on the most relevant institutional price zones without chart overcrowding. Users can customize the visualization by adjusting color, thickness, and line style to suit their individual trading preferences and visual analysis needs.
Why it may be useful
Institutional levels provide crucial insights into potential market movements by revealing where large investors and funds are likely to enter or exit positions. These levels represent psychologically significant price points where substantial trading volume has historically occurred, making them powerful tools for understanding market sentiment and potential price reversals.
By identifying these key levels, traders can make more informed decisions about entry and exit points, stop-loss placement, and overall trading strategy. The indicator helps bridge the gap between retail traders and institutional market participants, offering a strategic perspective on potential price action.
When to explore it
The NZTInstitutionalLevel indicator is most effective during periods of market consolidation or when price is approaching significant round number levels. Traders can utilize these levels during trending and ranging markets to identify potential support and resistance zones, helping to confirm or validate other technical analysis signals.
It works particularly well across multiple timeframes and asset classes, from forex and stocks to cryptocurrencies. Traders should combine this indicator with other technical analysis tools to increase the probability of successful trades and to gain a more comprehensive understanding of market dynamics.
Keep exploring
What we’ve verified
Access, alerts and repainting behaviour have not been independently verified for this indicator. Check the creator’s current publication and settings.
General descriptions and classifications are recovered research. Verified details above identify the specific checks we have completed. Check the creator’s current publication for later changes.