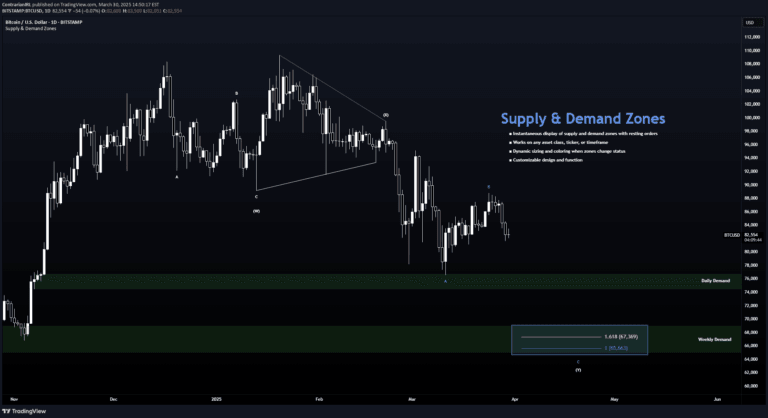
A visual trading tool that displays daily candles with color-coded indicators to help traders quickly assess market movements and price relationships across different timeframes.
Explore complementary indicator rolesHow it works
The script generates visual representations of daily candles by plotting colored boxes and wicks based on open, close, high, and low prices. Green boxes indicate bullish candles where the close price is higher than the open, while red boxes represent bearish candles where the close price is lower than the open.
Each candle is constructed with a body representing the price range between open and close, and wicks extending to show the high and low price points. When a new date is detected, the script automatically resets and begins drawing new candle representations, ensuring accurate and current visual tracking of price movements.
Why it may be useful
This candle visualization tool provides traders with an immediate, intuitive understanding of market dynamics by transforming raw price data into easily digestible visual information. The color-coded system allows quick identification of bullish and bearish price movements, helping traders rapidly assess market sentiment and potential trend directions.
By presenting price information in a visually clear format, the script reduces cognitive load and enables faster decision-making. Traders can quickly recognize price patterns, understand market momentum, and gain insights into potential trading opportunities without extensive manual analysis.
When to explore it
The candle visualization script is most effective during active trading sessions where real-time price movements are critical, such as day trading and scalping scenarios. It provides maximum value in markets with clear, distinct price movements where candle shapes and colors can reveal meaningful market dynamics.
Traders should utilize this tool when seeking to quickly interpret price action across multiple timeframes, assess market sentiment, and make rapid trading decisions. It is particularly useful for traders who prefer visual representations of market data and want to quickly understand the relationship between open, close, high, and low prices.
Keep exploring
What we’ve verified
Access, alerts and repainting behaviour have not been independently verified for this indicator. Check the creator’s current publication and settings.
General descriptions and classifications are recovered research. Verified details above identify the specific checks we have completed. Check the creator’s current publication for later changes.