
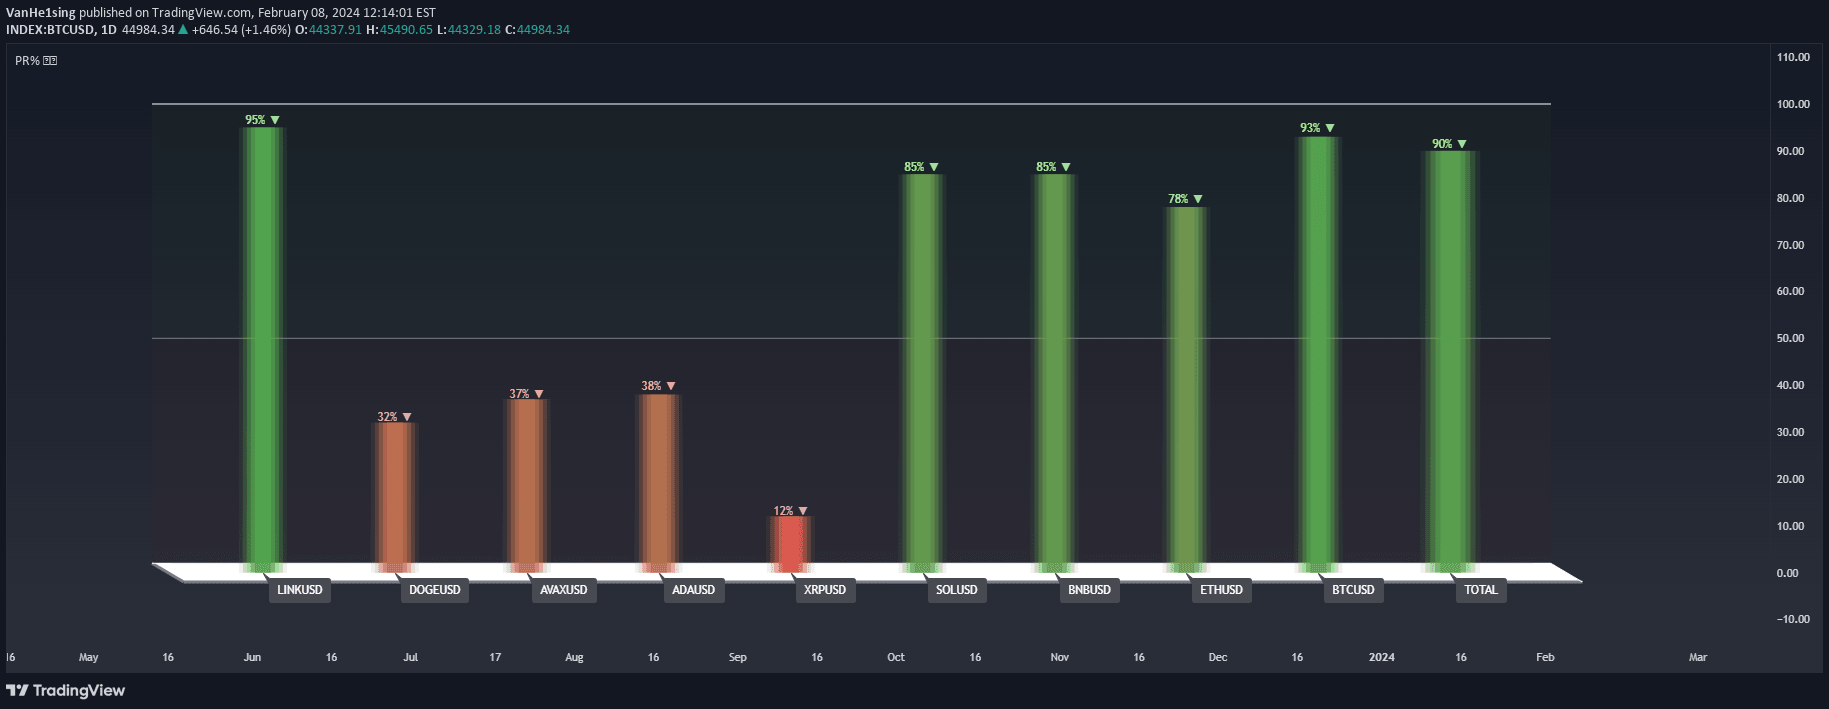
A Pine Script indicator that calculates and visualizes percent rank for multiple financial instruments, helping traders quickly assess relative performance across different assets.
Explore complementary indicator rolesHow it works
The indicator calculates the percent rank by comparing the current value to historical data points. It selects up to 10 financial instruments, typically focusing on cryptocurrencies. For each selected instrument, it determines the percentage of historical values that are less than or equal to the current value.
The results are displayed as color-coded columns with a gradient from red to green, representing the relative performance. Labels show the symbol name and percent rank percentage, with directional arrows indicating trend changes
Why it may be useful
This indicator provides traders with a quick visual comparison of multiple assets' performance. By using percent rank, it offers insights into relative strength and market dynamics. The color-coded visualization allows rapid identification of outperforming and underperforming assets.
Traders can quickly spot trends and compare different financial instruments simultaneously. The customizable parameters enable adaptation to various trading styles and preferences. The chart desk with scale lines provides additional context for interpreting the percent rank values
When to explore it
The percent rank indicator works best when comparing multiple assets within the same market sector or asset class. It is particularly useful for cryptocurrency traders analyzing top market cap coins. Traders can use this tool during market transitions to identify emerging trends and relative performance.
It is most effective in markets with clear trending characteristics. The indicator is valuable for portfolio managers comparing different assets' momentum. Swing traders and day traders can leverage this tool to make more informed asset selection decisions
Keep exploring
What we’ve verified
Access, alerts and repainting behaviour have not been independently verified for this indicator. Check the creator’s current publication and settings.
General descriptions and classifications are recovered research. Verified details above identify the specific checks we have completed. Check the creator’s current publication for later changes.


