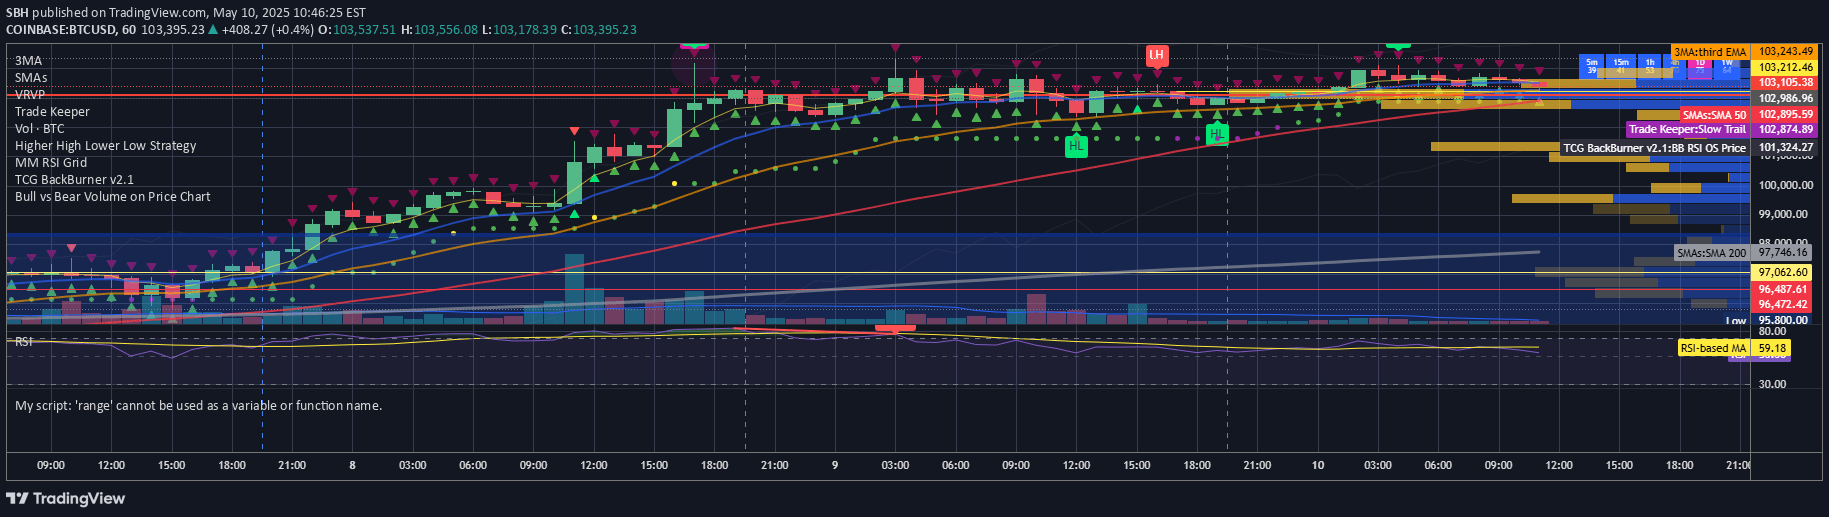
Dynamic Levels indicator tracks volume profile and price movements, revealing critical support/resistance zones and trader sentiment across multiple timeframes.
Explore complementary indicator rolesHow it works
The PhantomFlow Dynamic Levels indicator analyzes trading volume dynamics over a specified period, calculating volume distribution across different price levels. It generates dynamic support and resistance levels by tracking where most trading activity occurs, creating a volume profile that reveals key price zones where traders have shown significant interest.
The indicator uses a Period Multiplier to determine how many levels are displayed and an Accuracy parameter to refine volume calculations. By plotting lines representing volume distribution, it creates a visual representation of trader sentiment, showing the Point of Control (POC) and Value Area zones that represent where 70% of trading volume is concentrated.
Why it may be useful
Dynamic Levels provides traders with a sophisticated understanding of market sentiment by revealing where significant trading volume occurs at different price points. It transforms raw volume data into actionable insights, helping traders identify potential support and resistance zones that might not be visible through traditional price-based analysis.
By highlighting the Value Area and POC levels, the indicator gives traders a competitive edge in understanding market dynamics. These levels represent where most traders believe fair value exists, offering critical information about potential price reactions and market sentiment that standard indicators often miss.
When to explore it
The Dynamic Levels indicator is most effective in markets with consistent volume and clear trading ranges, where volume profile analysis can provide meaningful insights. It works exceptionally well for intraday trading strategies, helping traders identify potential entry and exit points based on volume concentration and market sentiment.
Traders should use this indicator across various timeframes, from short-term scalping to longer swing trading scenarios. It is particularly useful during periods of range-bound trading or when seeking to understand the underlying strength of price movements through volume analysis.
Keep exploring
What we’ve verified
Access, alerts and repainting behaviour have not been independently verified for this indicator. Check the creator’s current publication and settings.
General descriptions and classifications are recovered research. Verified details above identify the specific checks we have completed. Check the creator’s current publication for later changes.