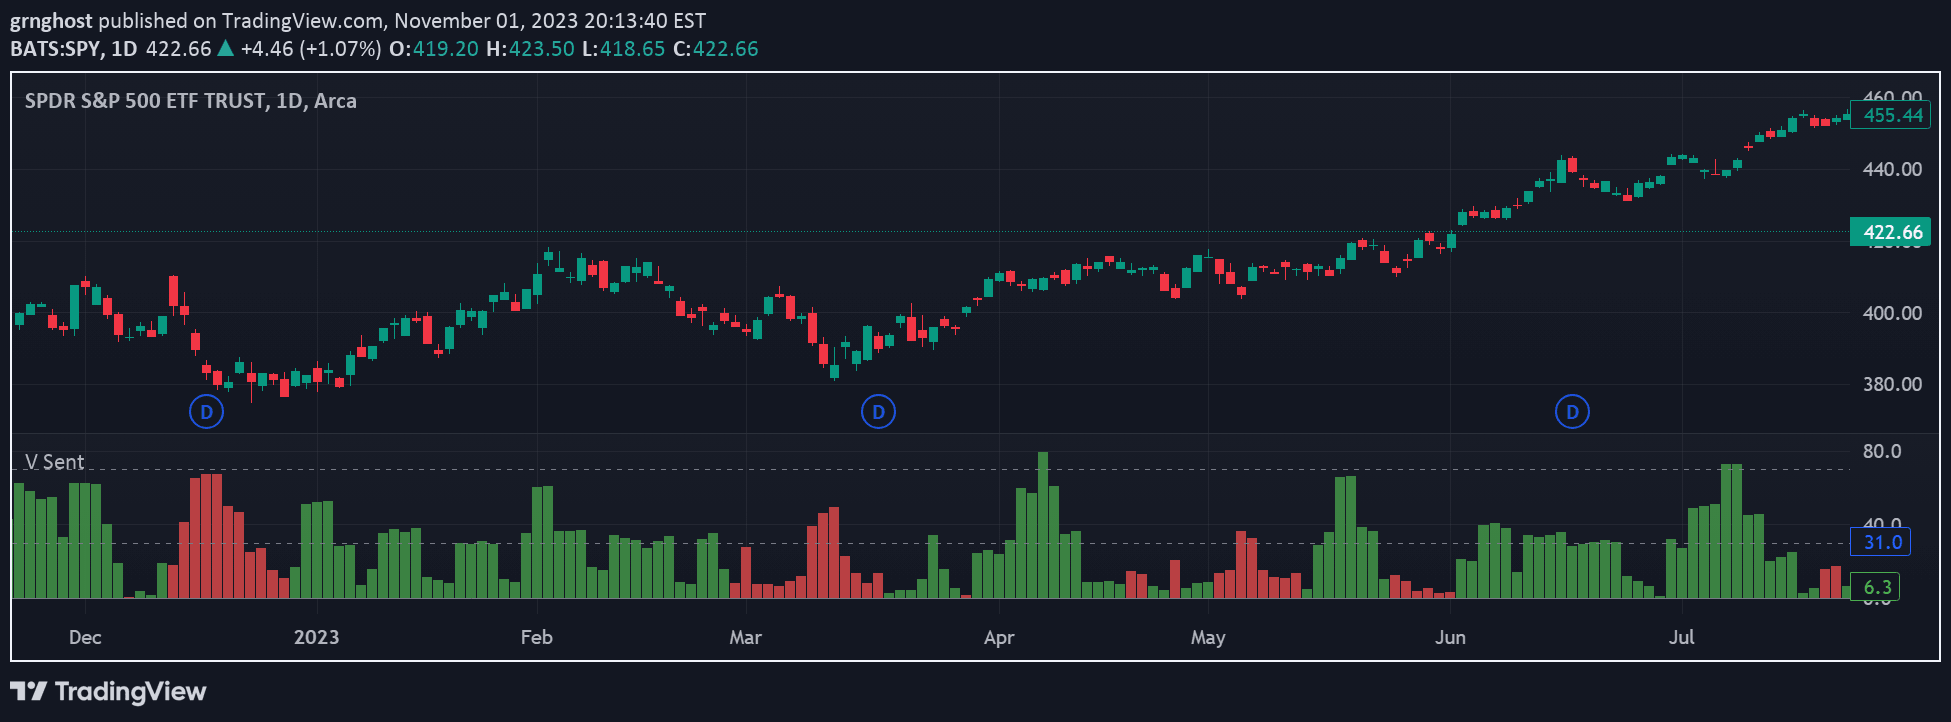
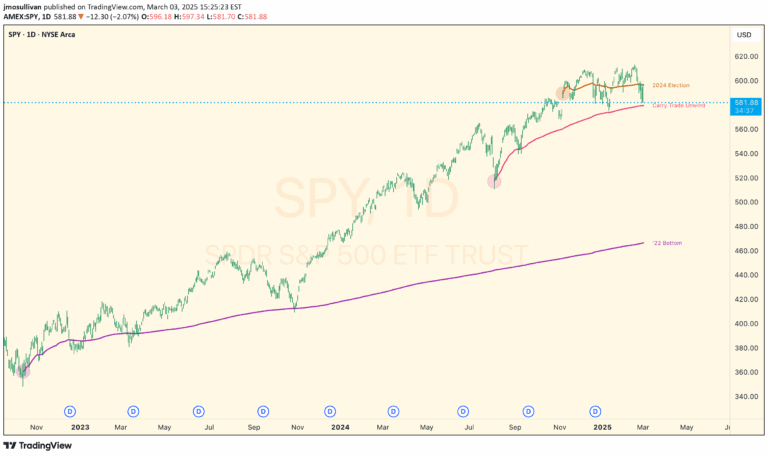
A volume analysis tool that highlights key market volume events using color-coded bars to reveal potential bullish and bearish volume dynamics across different trading conditions.
Explore complementary indicator rolesHow it works
The Pivot P/N Volumes indicator systematically analyzes volume data by comparing current volume levels against historical volume thresholds. It generates color-coded volume bars that reveal specific market volume characteristics, with blue bars indicating pocket pivot volumes, orange bars showing pivot negative volumes, and red and green bars highlighting above-average selling and buying volumes respectively.
The indicator uses a 10-day lookback period to establish volume baselines and compares current volume activity against these historical references. By tracking volume across up and down days, the tool provides traders with a clear visual representation of volume dynamics, allowing quick identification of significant market participation and potential trend strength.
Why it may be useful
Volume analysis is crucial for understanding market sentiment and potential price movements, as volume often precedes and confirms price action. This indicator simplifies complex volume data by presenting clear, color-coded signals that help traders quickly interpret market dynamics without getting overwhelmed by intricate details.
By highlighting specific volume events like pocket pivot volumes and pivot negative volumes, the tool enables traders to make more informed decisions about market entry and exit points. The color-coded approach allows for rapid visual assessment of buying and selling pressure, providing insights into potential trend reversals and market momentum.
When to explore it
The Pivot P/N Volumes indicator is most effective in markets with clear volume trends and during periods of significant price movement. It works particularly well in liquid markets like stocks, futures, and forex, where volume data provides meaningful insights into market participation and potential trend strength.
Traders should utilize this indicator during key market sessions, such as market opens, during important economic announcements, and when trading instruments with consistent volume patterns. It is especially useful for identifying potential trend reversals, confirming breakouts, and assessing the reliability of price movements through volume confirmation.
Keep exploring
What we’ve verified
Access, alerts and repainting behaviour have not been independently verified for this indicator. Check the creator’s current publication and settings.
General descriptions and classifications are recovered research. Verified details above identify the specific checks we have completed. Check the creator’s current publication for later changes.