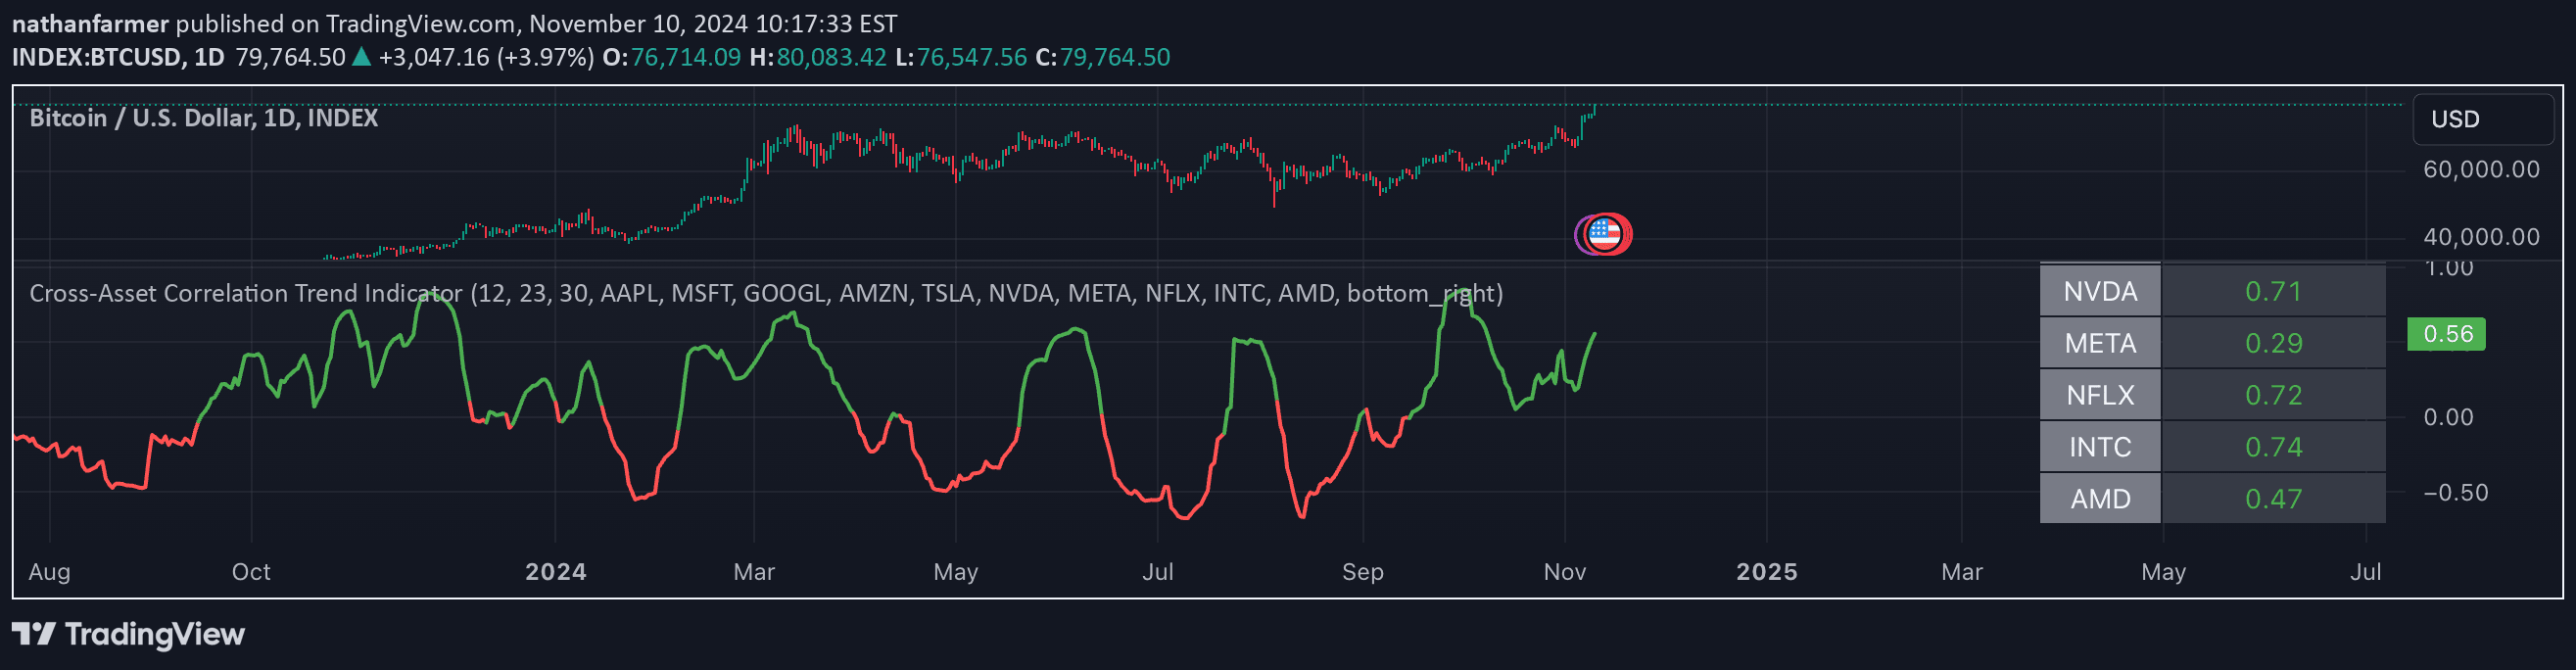
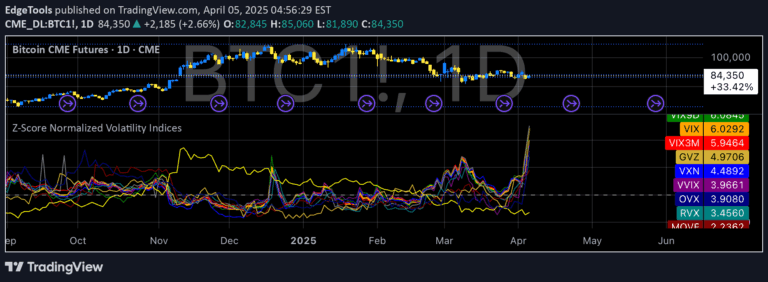
A statistical method to analyze the relationship between price and indicators, helping traders assess indicator reliability and potential market movements by measuring their correlation.
Explore complementary indicator rolesHow it works
The correlation coefficient is calculated by comparing the price movements of an asset with a specific indicator, measuring how closely they move together. This statistical analysis involves computing the degree of linear relationship between two variables, typically using mathematical formulas that assess their synchronization and directional alignment.
Traders compute this coefficient by examining price and indicator data over a specific timeframe, generating a value between -1 and 1. A value close to 1 indicates strong positive correlation, near 0 suggests weak correlation, and close to -1 represents a strong negative correlation between price and the selected indicator.
Why it may be useful
The correlation coefficient provides traders with a quantitative method to validate the reliability and effectiveness of different technical indicators in their trading strategy. By understanding how closely an indicator tracks price movements, traders can make more informed decisions about which tools to trust and incorporate into their analysis.
This statistical approach helps traders identify potential weaknesses in their current indicators and optimize their trading systems. It offers a scientific method to assess indicator performance, allowing traders to systematically evaluate and improve their technical analysis approach by selecting indicators with the strongest predictive capabilities.
When to explore it
Traders should utilize the correlation coefficient when evaluating new indicators or assessing the performance of existing technical analysis tools in their trading strategy. It is particularly useful during periods of market uncertainty or when developing and refining trading systems across different asset classes and timeframes.
The method is most effective when applied consistently across multiple market conditions and indicators, allowing traders to build a comprehensive understanding of how different technical tools interact with price movements. By regularly calculating and monitoring correlation coefficients, traders can continuously improve their analytical approach and adapt their strategies to changing market dynamics.
Keep exploring
What we’ve verified
Access, alerts and repainting behaviour have not been independently verified for this indicator. Check the creator’s current publication and settings.
General descriptions and classifications are recovered research. Verified details above identify the specific checks we have completed. Check the creator’s current publication for later changes.