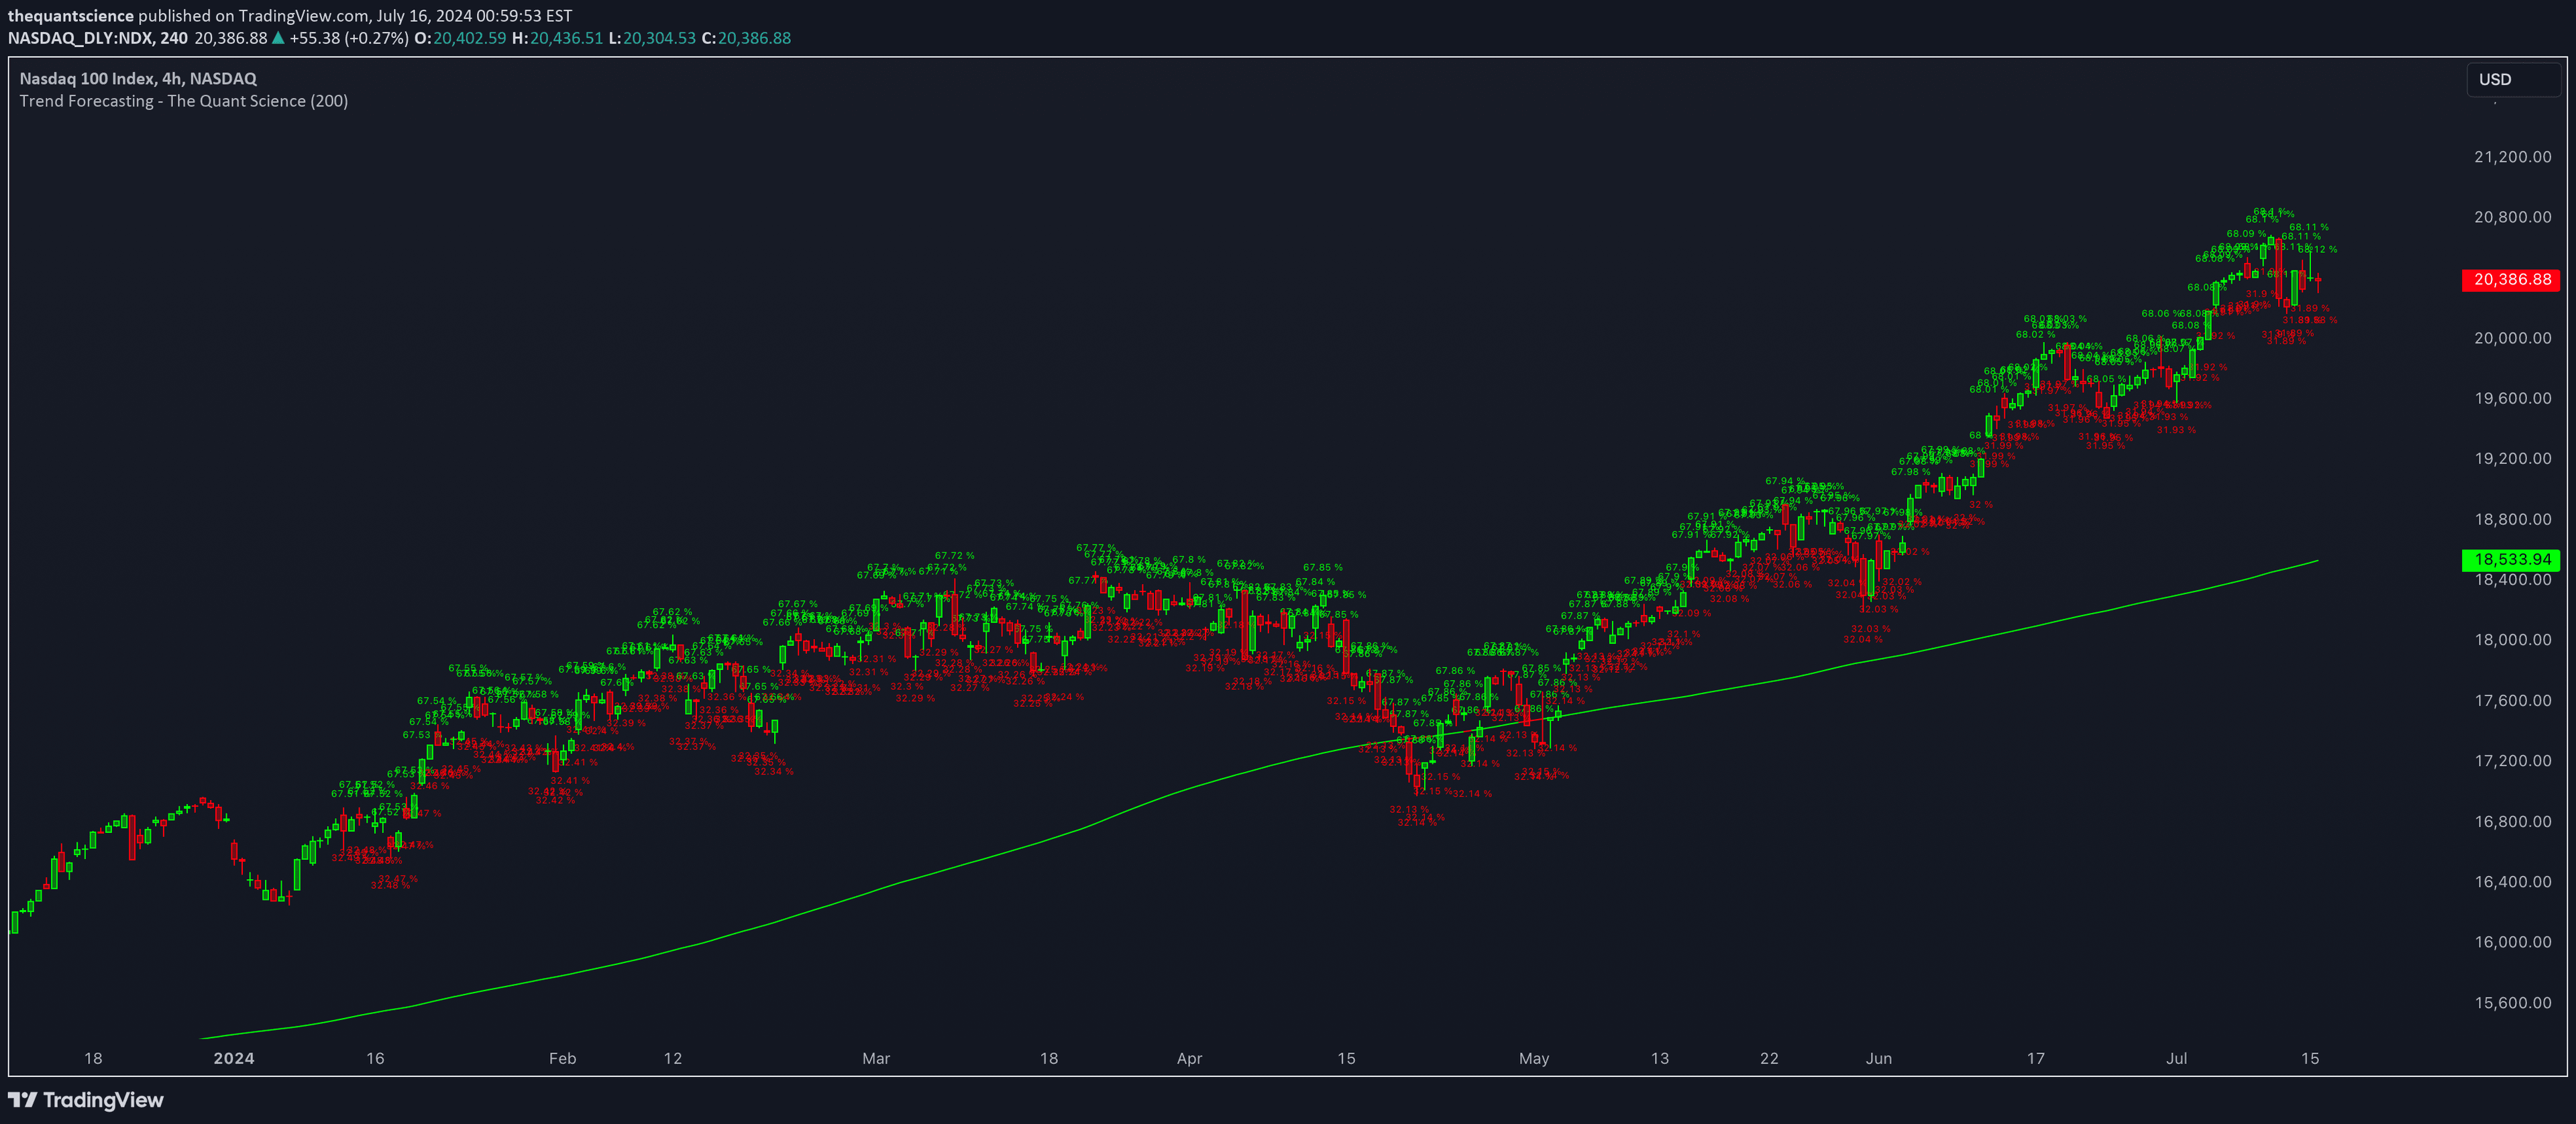
Price Scenarios is a quantitative statistical indicator that forecasts future price movements using mathematical probability and provides visual signals about potential market direction.
Explore complementary indicator rolesHow it works
The Price Scenarios indicator uses advanced statistical analysis to calculate the probability of future price movements. It generates mathematical predictions by analyzing historical price data over a configurable length of analysis, typically defaulting to 200 periods.
The indicator produces arrow-shaped signals that represent the probable future price movement, accompanied by a percentage probability calculation. Traders can customize the analysis period and set a probability threshold, allowing for flexible and personalized market analysis.
Why it may be useful
Price Scenarios provides traders with a quantitative approach to market forecasting, transforming complex statistical calculations into easy-to-understand visual signals. By converting mathematical probabilities into actionable insights, the indicator helps traders make more informed trading decisions based on statistical expectations.
The tool's ability to color-code candlesticks and display probability percentages allows traders to quickly assess potential market movements. This visual representation enables faster decision-making and helps traders identify high-probability trading opportunities with greater confidence.
When to explore it
Price Scenarios works best in markets with clear statistical patterns and when traders want a data-driven approach to market prediction. It is particularly useful for identifying potential trend reversals and continuation patterns based on statistical probability.
The indicator is most effective when combined with other technical analysis tools and when traders carefully adjust the analysis length and probability threshold to match the specific characteristics of the traded instrument. Traders should use it as part of a comprehensive trading strategy, not as a standalone decision-making tool.
Keep exploring
What we’ve verified
Access, alerts and repainting behaviour have not been independently verified for this indicator. Check the creator’s current publication and settings.
General descriptions and classifications are recovered research. Verified details above identify the specific checks we have completed. Check the creator’s current publication for later changes.