Breakout Probability (Expo)
Breakout Probability indicator calculates the likelihood of new market highs or lows by analyzing historical price action and displaying percentage probabilities for potential price levels.
Explore 11,183 indicators. Filter beyond the obvious.
Discover the tools that fit the way you trade.
11,183 tools to explore
Breakout Probability indicator calculates the likelihood of new market highs or lows by analyzing historical price action and displaying percentage probabilities for potential price levels.
A trading indicator tracking institutional investor actions by calculating probabilities of market structure changes and order flow direction for strategic trading decisions.
A tool that identifies potential price reversal zones using statistical probability by analyzing historical swing points and calculating precise percentile-based predictions.
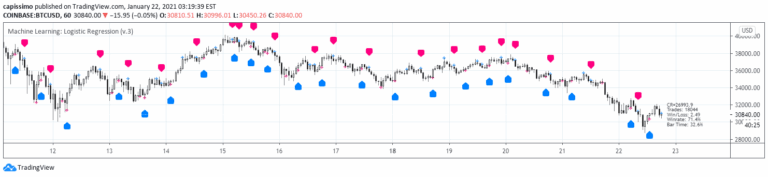
A machine learning strategy using logistic regression to classify market movements into binary categories by fitting a sigmoid curve to predict potential trading directions.
A sophisticated trading indicator using Bayesian probability theory and multiple moving averages to assess market trends and predict potential price direction with statistical precision.
A predictive indicator that estimates maximum and minimum price levels within a specified trading session, providing support/resistance insights and hit rate probabilities for traders.
A market analysis tool that calculates probabilities of price tops and bottoms across various time periods, offering traders strategic insights into market timing and potential trend reversals.
A probabilistic grid tool that visualizes potential price reversal locations using a 10x10 matrix, helping traders understand the likelihood of future market movements.
A grid trading strategy using martingale position sizing that doubles position size after losses, aiming to recover from previous trades by increasing exposure with each unsuccessful trade.
A powerful volume profiling tool that analyzes trading volumes across price levels, revealing market activity, support/resistance zones, and potential price movement probabilities.
A probability cone is a statistical forecast indicator that visualizes potential price distribution using standard or Laplace distributions, helping traders understand potential price movement ranges.
The Z-Score Probability indicator measures a stock's distance from the mean using standard deviation, providing insights into price distribution, potential retracements, and statistical probabilities of price movements.
Likes, views, and comments are historical TradingView snapshots. They describe attention, not trading performance.