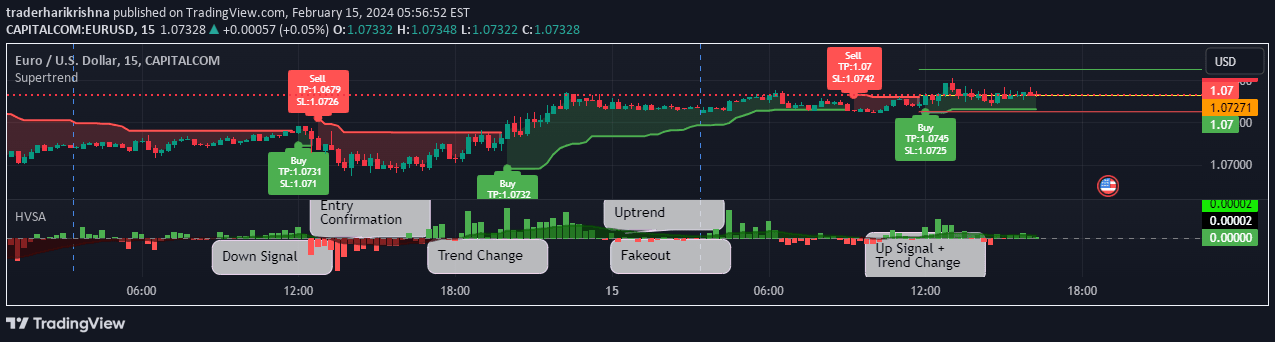
A modified Price Volume Trend indicator that uses a moving average signal line to identify bullish and bearish market environments based on price and volume interactions.
Explore complementary indicator rolesHow it works
The Price Volume Trend with Signal (PVTC) calculates a cumulative volume-based indicator that tracks the relationship between price changes and trading volume. It computes the percentage change in price and multiplies it by volume, creating a line that reflects price momentum and volume strength.
The indicator then applies a moving average (either EMA or SMA) to this line, creating a signal line for additional context. When the PVTC line crosses above the signal line, it suggests a bullish environment, and when it crosses below, it indicates a bearish market condition.
Why it may be useful
The PVTC helps traders understand the interplay between price movement and trading volume, providing insights into potential trend strength and market sentiment. By combining price percentage changes with volume, it offers a more comprehensive view of market dynamics than price-only indicators.
The added signal line allows traders to identify trend shifts and potential entry or exit points more effectively. The visual color-coding and cross highlighting make it easier to interpret market conditions quickly, enhancing decision-making processes for traders across different timeframes.
When to explore it
The PVTC is most effective in markets with clear trending characteristics, where volume can confirm price movements. It works best in liquid markets with consistent trading volume, such as major stock indices, forex pairs, and actively traded commodities.
Traders should use PVTC in conjunction with other technical indicators to validate signals and reduce false positives. It is particularly useful during trending market conditions and can help identify potential trend reversals or continuations when combined with complementary analytical tools.
Keep exploring
What we’ve verified
Access, alerts and repainting behaviour have not been independently verified for this indicator. Check the creator’s current publication and settings.
General descriptions and classifications are recovered research. Verified details above identify the specific checks we have completed. Check the creator’s current publication for later changes.