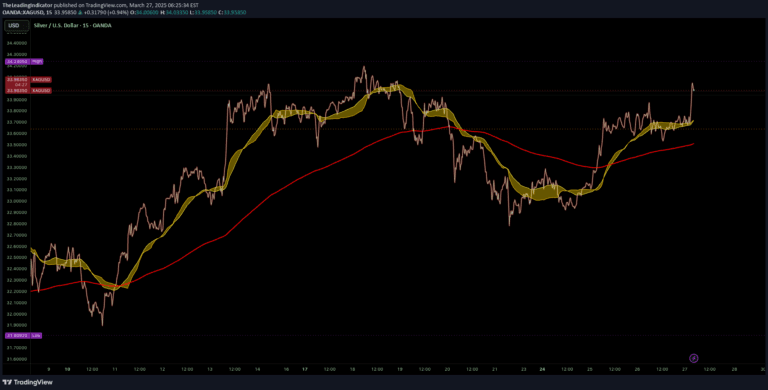
A flexible tool that generates visible-range profiles for almost any TradingView indicator, allowing traders to visualize and analyze indicator values dynamically.
Explore complementary indicator rolesHow it works
The 'Profile Any Indicator' script creates a dynamic profile visualization for selected indicators by capturing their plot values within the current visible chart range. It automatically adjusts the profile orientation based on chart scrolling, ensuring real-time adaptation to different chart views and zoom levels.
Traders can select any indicator with retrievable plot values and generate a profile that displays the distribution of those values. The script offers customization options like POC line placement, value area percentage, and panel positioning, making it a versatile tool for analyzing indicator performance across different market conditions.
Why it may be useful
This script provides traders with a unique analytical perspective by transforming indicator data into a visual profile representation. It allows for deeper insights into indicator behavior by showing the frequency and distribution of values, which can help identify potential market tendencies and statistical characteristics of different trading signals.
By offering flexible visualization options and compatibility with multiple indicators, the tool enables traders to enhance their technical analysis approach. It bridges the gap between raw indicator data and meaningful visual interpretation, supporting more informed trading decisions across various market environments.
When to explore it
The 'Profile Any Indicator' script is most effective when traders want to gain a statistical understanding of an indicator's performance across different market conditions. It works exceptionally well with momentum, volume, and oscillator indicators that have consistent plot values throughout price movements.
Traders can leverage this tool during market analysis, strategy development, and performance evaluation. It is particularly useful when comparing different indicators, understanding their value distributions, and identifying potential patterns or anomalies that might not be immediately apparent from traditional chart representations.
Keep exploring
What we’ve verified
Access, alerts and repainting behaviour have not been independently verified for this indicator. Check the creator’s current publication and settings.
General descriptions and classifications are recovered research. Verified details above identify the specific checks we have completed. Check the creator’s current publication for later changes.