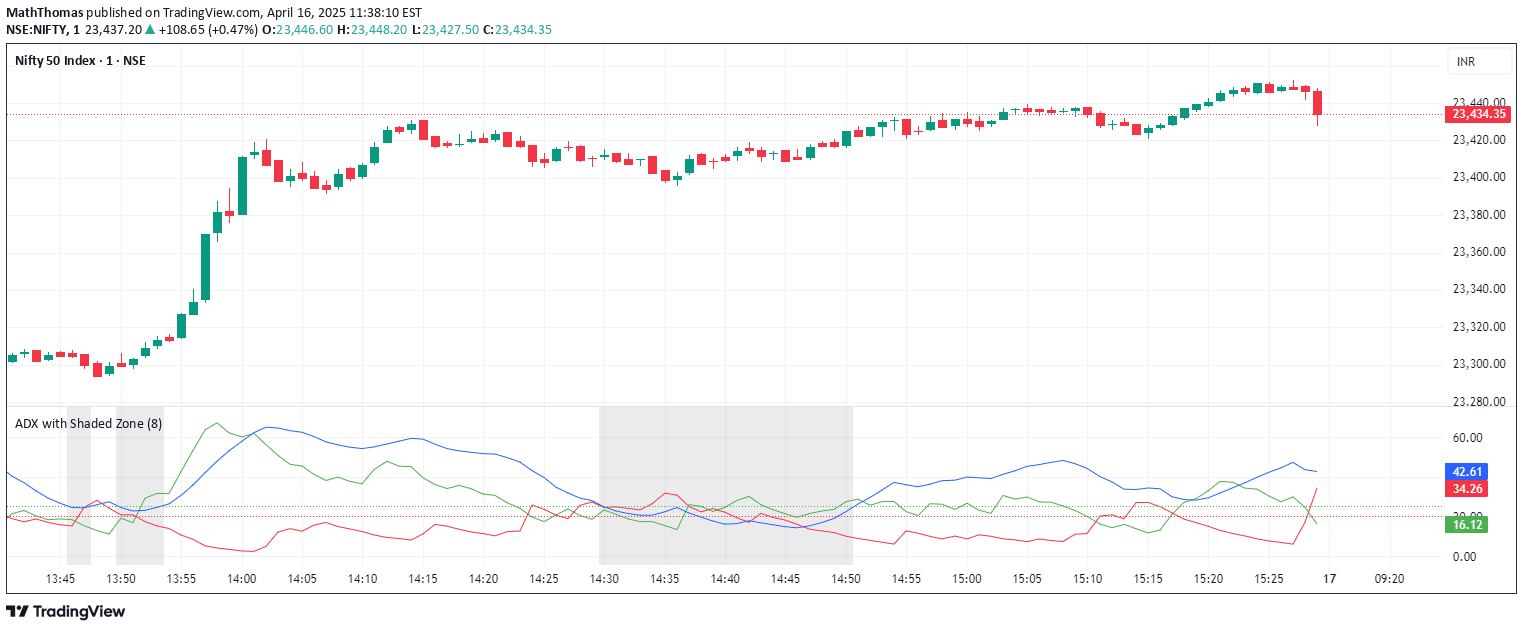
The Qualitative Smoothed Strength Index (QSSI) is a simplified momentum oscillator that converts price differences into binary values to identify trend strength and potential market reversals.
Explore complementary indicator rolesHow it works
The QSSI calculates differences between high, low, and close prices relative to their simple moving averages over a specified length, typically 5 periods. These differences are then converted into binary values (0 or 1) to represent upward or downward price movements.
The indicator then computes the average of these binary values and applies a moving average, usually 14 periods long, to smooth out the results. This process creates a simplified representation of price momentum that oscillates between 0 and 1, allowing traders to quickly interpret market strength and direction.
Why it may be useful
The QSSI provides traders with a clear, simplified view of market momentum by reducing market noise and converting complex price movements into easily interpretable binary signals. By breaking down price components into discrete upward or downward movements, the indicator helps traders understand the underlying market dynamics more intuitively.
Its ability to smooth out price variations and present a concise representation of market strength makes it valuable for traders seeking to identify trends, potential reversals, and overall market sentiment with less lag compared to traditional oscillators.
When to explore it
The QSSI is most effective in markets with clear directional movements and when traders want to quickly assess the strength of price trends across different timeframes. It works particularly well in identifying early trend signals and potential reversals, making it suitable for both short-term and medium-term trading strategies.
Traders should use the QSSI in conjunction with other technical indicators, paying special attention to its overbought (above 0.70 or 0.80) and oversold (below 0.30 or 0.20) levels to confirm potential entry and exit points in various market conditions.
Keep exploring
What we’ve verified
Access, alerts and repainting behaviour have not been independently verified for this indicator. Check the creator’s current publication and settings.
General descriptions and classifications are recovered research. Verified details above identify the specific checks we have completed. Check the creator’s current publication for later changes.