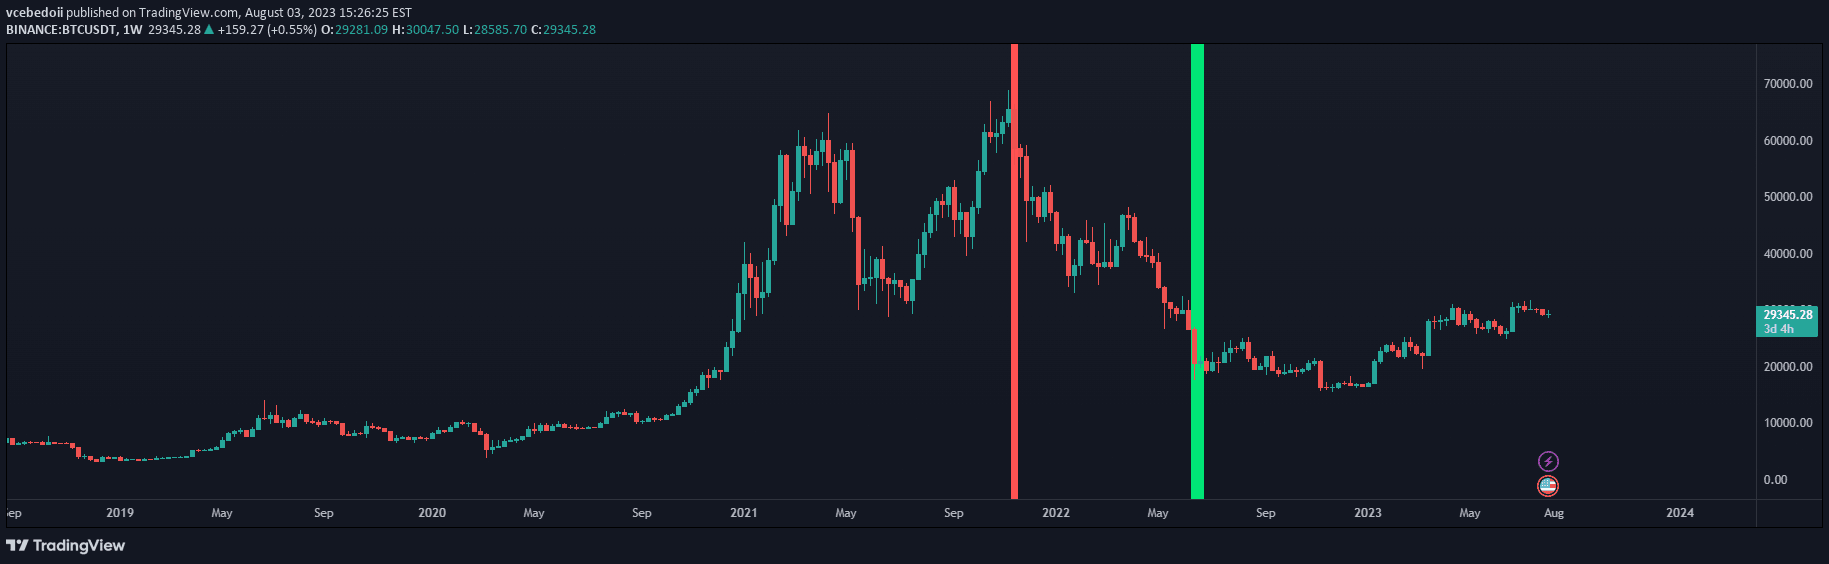
A dynamic channel indicator that calculates price movement relative to a moving average, creating adaptive upper and lower bands and an oscillator to highlight price deviation trends.
Explore complementary indicator rolesHow it works
The indicator starts by selecting a moving average type and calculating its value over a specified lookback period. It then computes the percentage difference between the price and the moving average, creating a relative measurement of price deviation.
By separately averaging positive and negative price differences, the indicator generates dynamic upper and lower channel bands around the moving average. An accompanying histogram visualizes these differences, with color-coded bars representing price positions above or below the moving average, helping traders understand market momentum and price behavior.
Why it may be useful
This adaptive channel indicator provides traders with a flexible tool for understanding price movement relative to its average trend. Unlike static indicators, it dynamically adjusts to current market conditions, offering real-time insights into potential overbought or oversold scenarios.
By presenting both a visual channel and an oscillator, traders can quickly assess market momentum, identify potential trend reversals, and make more informed trading decisions. The indicator's ability to show both absolute price position and relative deviation makes it a powerful analytical tool for understanding market dynamics.
When to explore it
The indicator is most effective in markets with clear directional movements and moderate volatility. Traders can use it to identify potential entry and exit points by observing how price interacts with the dynamic channel edges and oscillator thresholds.
It works particularly well for confirming trend strength, detecting potential trend reversals, and providing early warning signals for changing market conditions. Traders should combine this indicator with other technical analysis tools to enhance its predictive power and reduce false signal risks.
Keep exploring
What we’ve verified
Access, alerts and repainting behaviour have not been independently verified for this indicator. Check the creator’s current publication and settings.
General descriptions and classifications are recovered research. Verified details above identify the specific checks we have completed. Check the creator’s current publication for later changes.