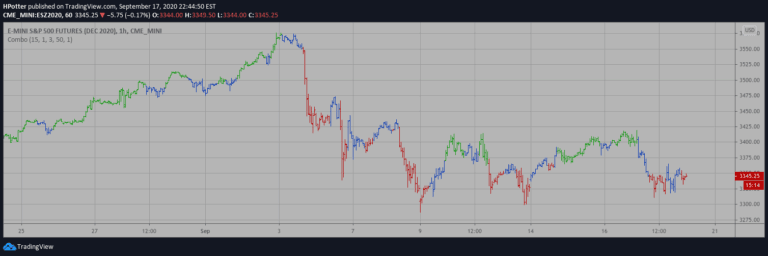
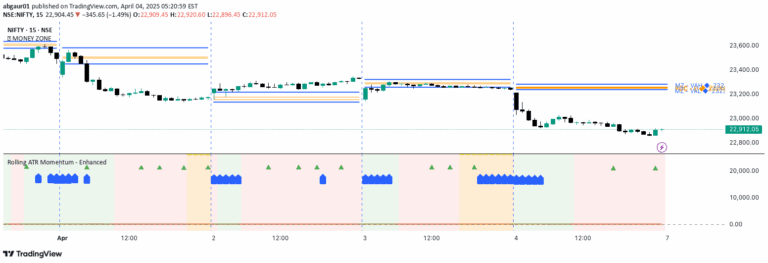
An advanced trading tool that reverse engineers oscillator price levels, allowing traders to calculate precise thresholds and analyze momentum from multiple technical indicators.
Explore complementary indicator rolesHow it works
This signal works by mathematically reversing traditional oscillator calculations to determine exact price levels corresponding to specific oscillator values. It uses three primary reverse engineering functions: Reverse Relative Strength Index (RRSI), Reverse Stochastic Oscillator (RStoch), and Reverse Commodity Channel Index (RCCI).
The tool allows users to downsample data at various rates including bars per sample, time intervals, and price action changes. By rearranging standard oscillator formulas, traders can plug in oscillator values to calculate corresponding price levels
Why it may be useful
This signal provides traders with a unique perspective on momentum indicators by transforming abstract oscillator readings into concrete price levels. It offers deeper insights into market dynamics by revealing precise thresholds for overbought and oversold conditions.
Traders gain enhanced visibility into potential trend reversals and momentum shifts. The tool's flexibility in sampling rates allows for noise reduction and more robust trend analysis. By translating oscillator values into tangible price points, traders can make more informed decisions
When to explore it
This signal works best during trending markets with clear momentum characteristics. It is particularly useful for traders seeking to identify potential trend reversals and confirm momentum shifts. The tool is most effective when used across multiple timeframes and combined with other technical analysis methods.
Traders can leverage its capabilities during periods of consolidation or when looking to validate entry and exit points. Its multiple calculation methods make it adaptable to various market conditions and trading styles
Keep exploring
What we’ve verified
Access, alerts and repainting behaviour have not been independently verified for this indicator. Check the creator’s current publication and settings.
General descriptions and classifications are recovered research. Verified details above identify the specific checks we have completed. Check the creator’s current publication for later changes.