Trending RSI [ChartPrime]
Trending RSI enhances traditional RSI by introducing trend information, breaking free from 0-100 range and providing more nuanced market insights through a centered oscillator.
Explore 11,183 indicators. Filter beyond the obvious.
Discover the tools that fit the way you trade.
11,183 tools to explore
Trending RSI enhances traditional RSI by introducing trend information, breaking free from 0-100 range and providing more nuanced market insights through a centered oscillator.
An advanced trading tool that reverse engineers oscillator price levels, allowing traders to calculate precise thresholds and analyze momentum from multiple technical indicators.
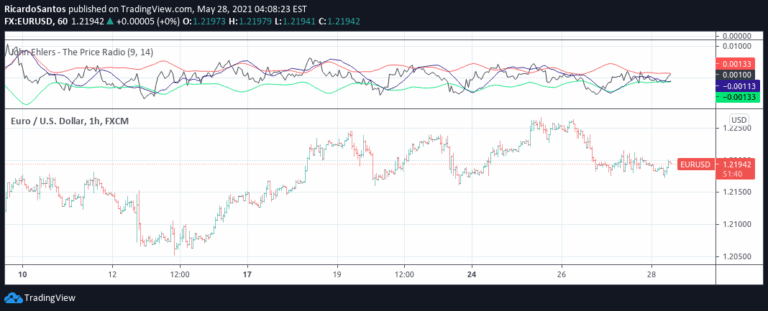
An innovative signal processing technique that treats price curves like radio waves, using AM and FM demodulation to extract trading signals from market noise.
An advanced indicator calculating the ratio between price and moving average, providing multiple levels and percentile analysis to help traders identify potential entry and exit points.
The Reverse Relative Strength Index reveals potential price levels for specific RSI values, helping traders anticipate market movements and interpret price-momentum relationships.
An advanced RSI indicator that provides multiple customizable levels, trend visualization, and comprehensive alerts for precise market analysis and trading decision-making.
Advanced error function (ERF) exploration designed to provide sophisticated mathematical computations for probability analysis, statistical research, and complex scientific modeling across multiple disciplines.
A powerful trading indicator combining RSI and Detrended Price Oscillator to identify overbought/oversold conditions and support/resistance levels directly on the price chart.
Advanced machine learning-enhanced VWAP indicator using adaptive algorithms to predict volume patterns and generate precise trading signals with dynamic confidence zones.
An advanced market analysis tool using convolution and probability functions to predict potential market changes by analyzing price dynamics and calculating statistical probabilities.
The Ehlers Reverse EMA is an advanced momentum indicator that identifies trend direction and potential reversals using a sophisticated reverse-engineering approach with dynamic color coding and multiple signal generation methods.
Likes, views, and comments are historical TradingView snapshots. They describe attention, not trading performance.