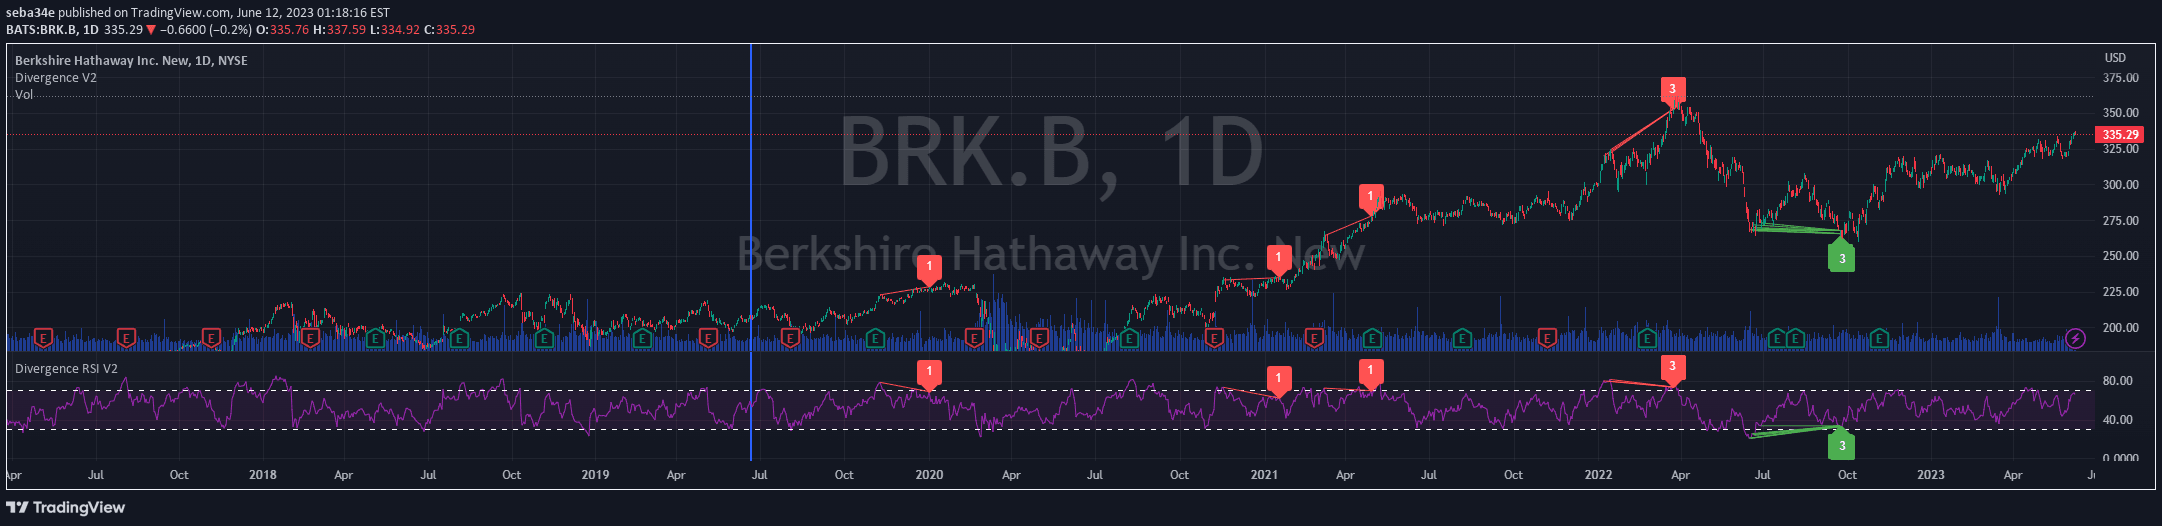
RSI Divergence identifies potential trend reversals by comparing price movement with the Relative Strength Index momentum, highlighting discrepancies between price action and underlying market strength.
Explore complementary indicator rolesHow it works
The RSI Divergence indicator compares price action with the Relative Strength Index by tracking pivot points and analyzing momentum shifts. It calculates a 14-period RSI that oscillates between 0 and 100, identifying overbought and oversold conditions.
When price makes a new high or low that doesn't align with corresponding RSI movement, a potential divergence signal is generated. The script examines lookback periods to confirm these divergences, plotting green labels for bullish signals and red labels for bearish signals when specific momentum and price conditions are met.
Why it may be useful
RSI Divergence provides traders with a powerful tool to anticipate potential trend reversals before they occur in the market. By revealing hidden momentum shifts, traders can identify moments when price movement might be losing steam or preparing to change direction.
The indicator helps traders make more informed decisions by highlighting discrepancies between price action and underlying market momentum. This can provide early warning signs of potential trend changes, allowing traders to adjust their strategies proactively and potentially enter or exit trades at more advantageous moments.
When to explore it
RSI Divergence works best in volatile markets with clear trending or ranging price movements. Traders should use this indicator in conjunction with other technical analysis tools to confirm signals and reduce false positives.
The indicator is particularly effective when markets show significant price swings and when momentum seems to be diverging from price action. Traders should pay special attention to divergence signals in timeframes that match their trading strategy, whether scalping, day trading, or swing trading.
Keep exploring
What we’ve verified
Access, alerts and repainting behaviour have not been independently verified for this indicator. Check the creator’s current publication and settings.
General descriptions and classifications are recovered research. Verified details above identify the specific checks we have completed. Check the creator’s current publication for later changes.