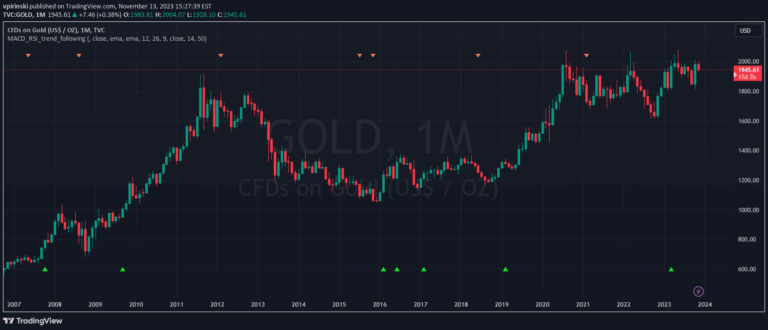
A hybrid trading signal combining RSI and MACD to assess market momentum, using color-coded candles to visually indicate bullish, neutral, and bearish market conditions.
Explore complementary indicator rolesHow it works
The indicator evaluates three key technical conditions: RSI above 50, MACD line above signal line, and MACD line above zero. These conditions create a comprehensive momentum assessment using multiple technical analysis tools.
By analyzing these conditions simultaneously, the system generates color-coded candles that instantly communicate market sentiment. Green candles represent full bullish alignment, grey candles indicate partial momentum, and red candles signal bearish market conditions.
Why it may be useful
This signal provides traders with a quick, visual method to assess market momentum and potential trading opportunities. By combining multiple technical indicators, it offers a more nuanced view of market conditions than single-indicator approaches.
The color-coding system allows traders to rapidly interpret complex technical information, making it easier to identify potential entry and exit points without extensive manual analysis.
When to explore it
The indicator performs best in trending markets with clear directional movement. Traders should use it in conjunction with other technical analysis tools and consider broader market context when making trading decisions. It is particularly useful for identifying potential trend changes, confirming momentum shifts, and providing visual cues about market sentiment across different timeframes and trading styles.
Keep exploring
What we’ve verified
Access, alerts and repainting behaviour have not been independently verified for this indicator. Check the creator’s current publication and settings.
General descriptions and classifications are recovered research. Verified details above identify the specific checks we have completed. Check the creator’s current publication for later changes.