
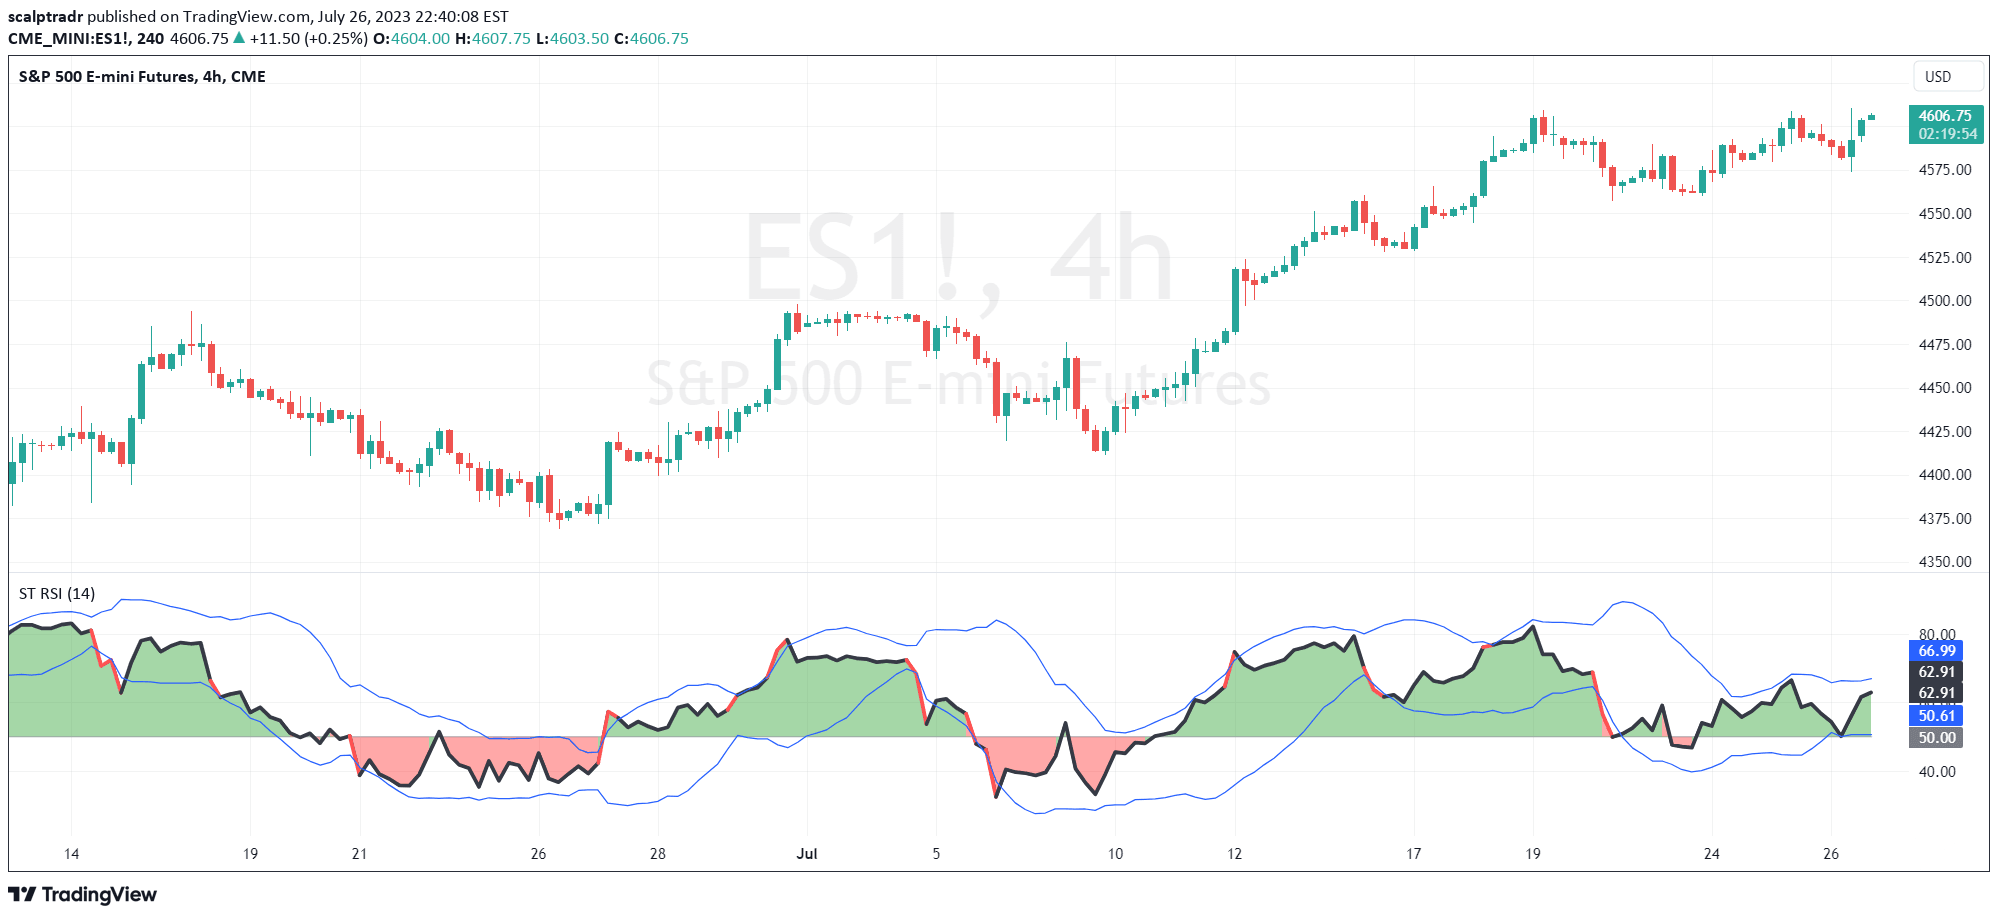
A custom Relative Strength Index (RSI) indicator that measures market momentum and provides optional Bollinger Bands overlay to assess price volatility and potential trend reversals.
Explore complementary indicator rolesHow it works
The RSI calculates momentum by comparing average gains and losses over a specified period, typically 14 days. It transforms this relative strength into a oscillating value between 0 and 100, which helps traders identify potential overbought or oversold market conditions.
When combined with Bollinger Bands, the indicator adds another layer of analysis by measuring price volatility. The middle band represents a moving average, while the outer bands show standard deviations, providing traders with additional insights into market momentum and potential price movements.
Why it may be useful
The RSI helps traders understand market momentum by revealing whether an asset is potentially overbought or oversold, which can signal potential trend reversals or continuation. By providing a numerical representation of price movement strength, traders can make more informed decisions about entry and exit points.
The optional Bollinger Bands overlay enhances the analysis by measuring market volatility, allowing traders to assess not just momentum, but also the potential range and stability of price movements. This comprehensive approach provides a more nuanced understanding of market dynamics.
When to explore it
The RSI is most effective in markets with clear trending or ranging conditions, where momentum signals can provide meaningful insights. Traders should use the indicator in conjunction with other technical analysis tools to confirm signals and reduce false positives.
The Bollinger Bands overlay is particularly useful during periods of market uncertainty or potential trend changes, helping traders identify potential breakout or breakdown points. It works best when combined with other trend and momentum indicators to validate potential trading opportunities.
Keep exploring
What we’ve verified
Access, alerts and repainting behaviour have not been independently verified for this indicator. Check the creator’s current publication and settings.
General descriptions and classifications are recovered research. Verified details above identify the specific checks we have completed. Check the creator’s current publication for later changes.


