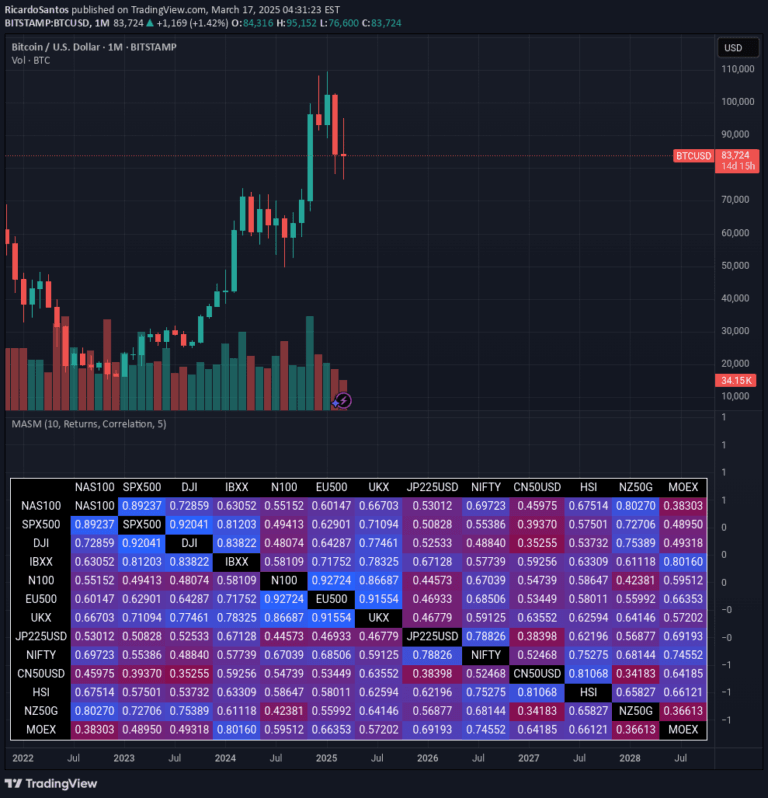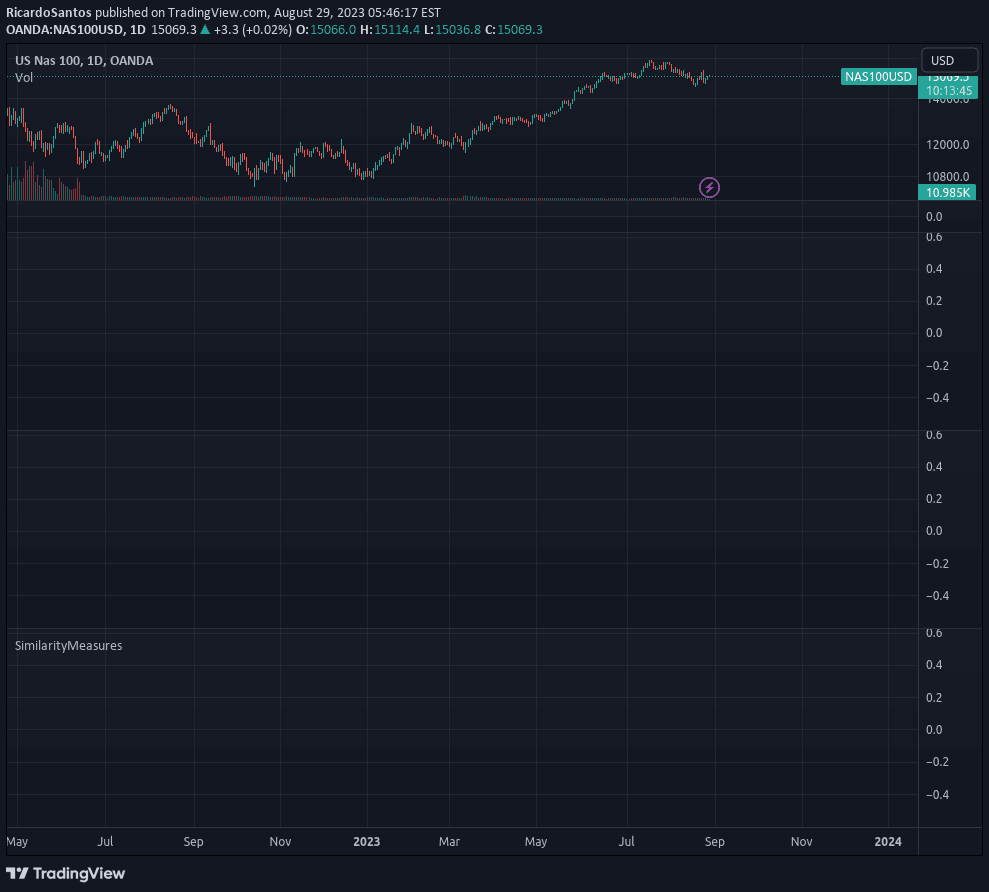
Similarity measures are statistical methods that quantify the distance and relationship between different data sets, comparing vectors, strings, and probability distributions across various dimensions.
Explore complementary indicator rolesHow it works
Similarity measures calculate the distance or relationship between different data sets using mathematical algorithms. They compare vectors by computing differences across multiple dimensions, such as squared differences, absolute differences, or angular separations.
Different methods like Euclidean, Manhattan, or Cosine distance provide unique ways of measuring how close or different two sets of data are. These calculations involve comparing each corresponding element between two vectors, applying specific mathematical transformations to quantify their similarity or dissimilarity
Why it may be useful
Similarity measures are critical in data analysis, machine learning, and pattern recognition by providing quantitative methods to compare and understand complex datasets. They help identify relationships, detect patterns, and make informed decisions across various fields including finance, biology, and computer science.
These techniques enable researchers and analysts to discover subtle connections, classify data points, and develop predictive models. By providing a numeric representation of similarity, they transform abstract comparisons into precise, measurable insights
When to explore it
Similarity measures are most effective when working with structured numerical data or categorical information that can be represented as vectors. They are particularly useful in clustering algorithms, recommendation systems, and predictive modeling.
Researchers and data scientists apply these techniques when comparing historical trends, analyzing market behaviors, or detecting anomalies in complex datasets. The choice of similarity measure depends on the specific characteristics of the data and the desired analytical outcome
Keep exploring
What we’ve verified
Access, alerts and repainting behaviour have not been independently verified for this indicator. Check the creator’s current publication and settings.
General descriptions and classifications are recovered research. Verified details above identify the specific checks we have completed. Check the creator’s current publication for later changes.