
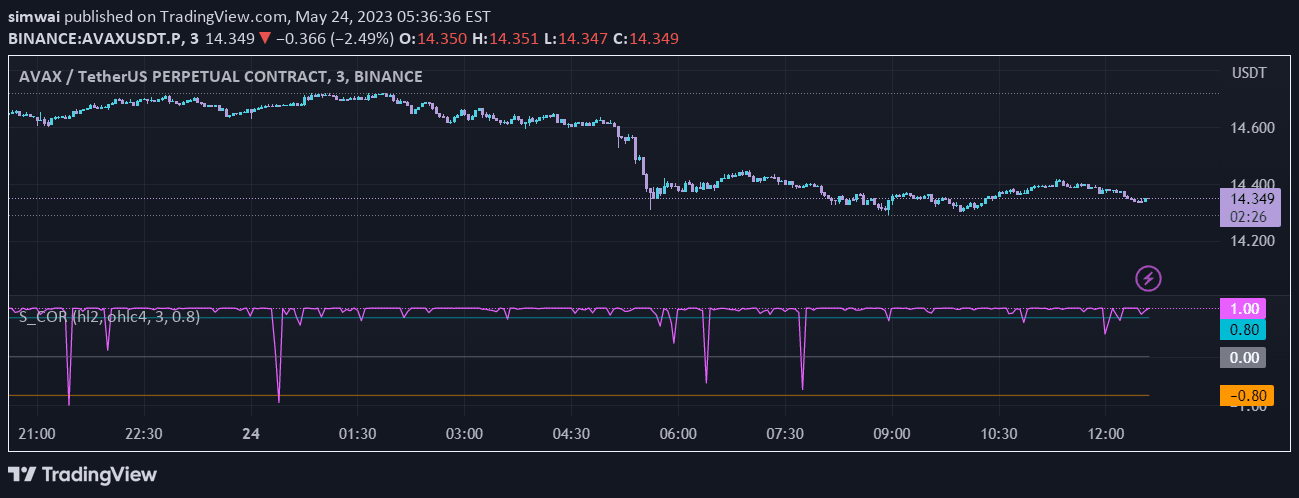
A unique indicator that measures correlation between two different input sources to help traders identify uncorrelated trading indicators for more robust strategy development.
Explore complementary indicator rolesHow it works
The correlation indicator calculates the statistical relationship between two selected input sources by analyzing their price movements and interactions. It uses mathematical algorithms to determine how closely or differently these sources move in relation to each other, generating a correlation coefficient that ranges from -1 to +1.
Traders can input any two different trading indicators or price series to compare their synchronicity. The resulting correlation value helps identify whether the selected sources move together, inversely, or independently, which can provide insights into potential diversification and risk management strategies.
Why it may be useful
Understanding indicator correlation is crucial for developing robust trading strategies that minimize redundant signals and maximize independent information sources. By identifying uncorrelated indicators, traders can build more reliable and diversified analytical approaches that reduce the risk of confirmation bias and overreliance on similar market perspectives.
The correlation tool provides traders with a quantitative method to assess the uniqueness of their technical analysis tools. This helps in constructing more sophisticated trading systems that leverage complementary information sources, ultimately improving decision-making and potentially enhancing overall trading performance.
When to explore it
The correlation indicator is most effective when traders are developing new trading strategies or seeking to optimize existing analytical frameworks. It is particularly useful during strategy development phases when evaluating the independent characteristics of different technical indicators and their potential complementary roles.
Traders should utilize this tool when experimenting with multiple indicators, looking to reduce signal redundancy, or aiming to create more sophisticated multi-indicator trading systems. It is especially valuable for systematic traders who rely on quantitative approaches and want to ensure their strategy incorporates diverse and non-repetitive market insights.
Keep exploring
What we’ve verified
Access, alerts and repainting behaviour have not been independently verified for this indicator. Check the creator’s current publication and settings.
General descriptions and classifications are recovered research. Verified details above identify the specific checks we have completed. Check the creator’s current publication for later changes.


