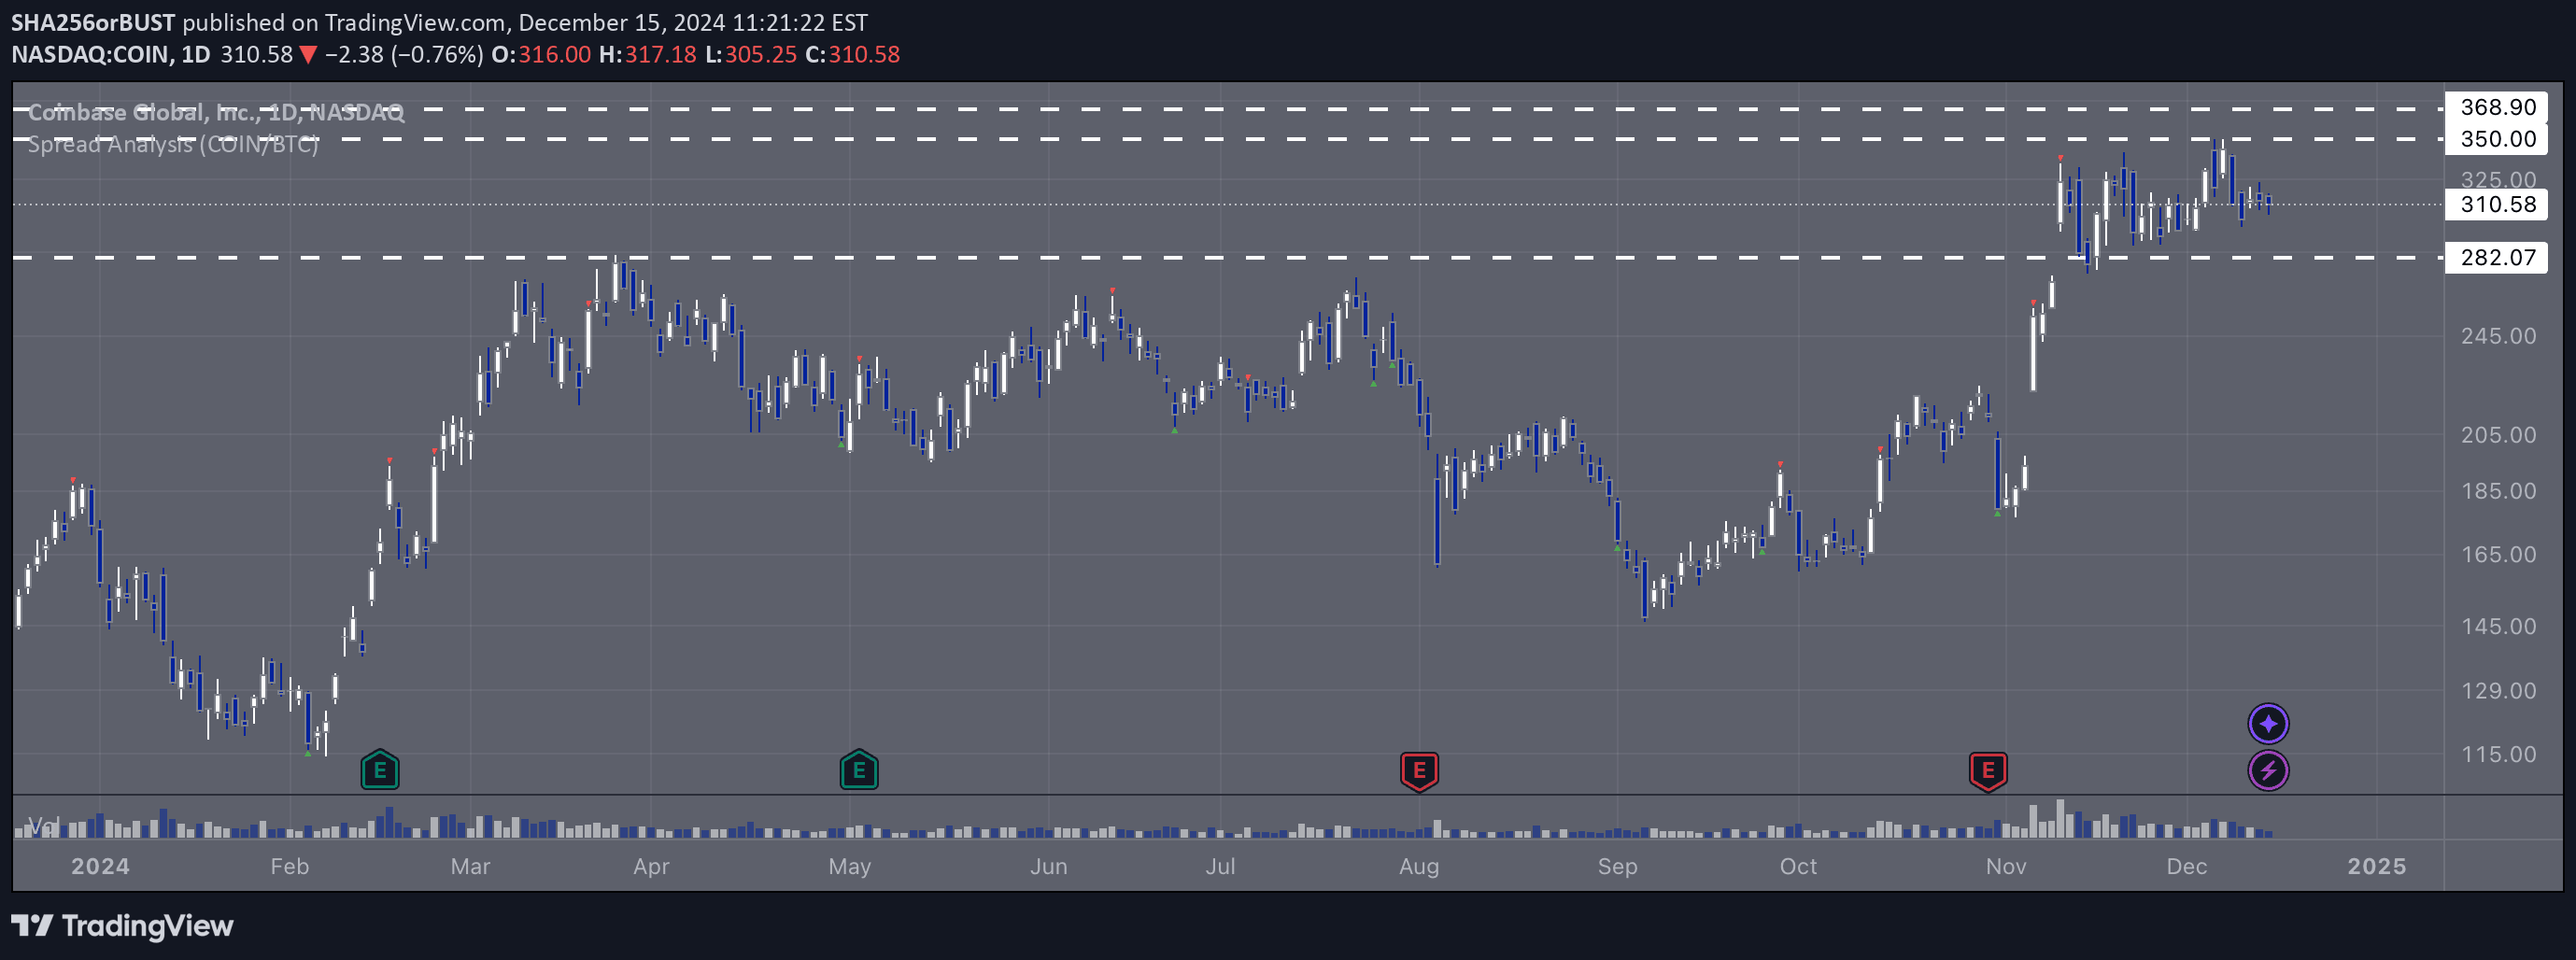
A Z-score analysis comparing Coinbase stock to Bitcoin prices, identifying potential relative valuation opportunities by measuring price ratio deviations.
Explore complementary indicator rolesHow it works
The Spread Analysis calculates a Z-score by comparing the current price ratio between Coinbase stock and Bitcoin to its historical average. It measures how many standard deviations the current ratio is from the mean, allowing traders to quantify the relative valuation between these two assets.
When the Z-score falls below -2, it suggests Coinbase stock is potentially undervalued relative to Bitcoin, triggering a buy signal. Conversely, when the Z-score exceeds +2, it indicates potential overvaluation, generating a sell signal that suggests a possible price correction or reversion to the mean.
Why it may be useful
This indicator provides a sophisticated method for comparing two different but related financial instruments, offering insights beyond traditional price analysis. By quantifying the relative valuation between a cryptocurrency exchange stock and the primary cryptocurrency, traders can identify potential mispricing and investment opportunities.
The Z-score approach allows for a more nuanced understanding of market relationships, helping traders make more informed decisions based on statistical deviations rather than relying solely on absolute price movements. It transforms complex price interactions into clear, actionable trading signals.
When to explore it
The Spread Analysis is most effective in range-bound market conditions where historical correlations between Coinbase and Bitcoin remain relatively stable. It works best when examining medium-term trends and looking for potential mean reversion opportunities in the relationship between these two assets.
Traders should be cautious and use this indicator in conjunction with other analysis techniques, particularly during periods of significant market volatility or when independent price drivers like major news events or earnings reports might disrupt the typical price relationship.
Keep exploring
What we’ve verified
Access, alerts and repainting behaviour have not been independently verified for this indicator. Check the creator’s current publication and settings.
General descriptions and classifications are recovered research. Verified details above identify the specific checks we have completed. Check the creator’s current publication for later changes.