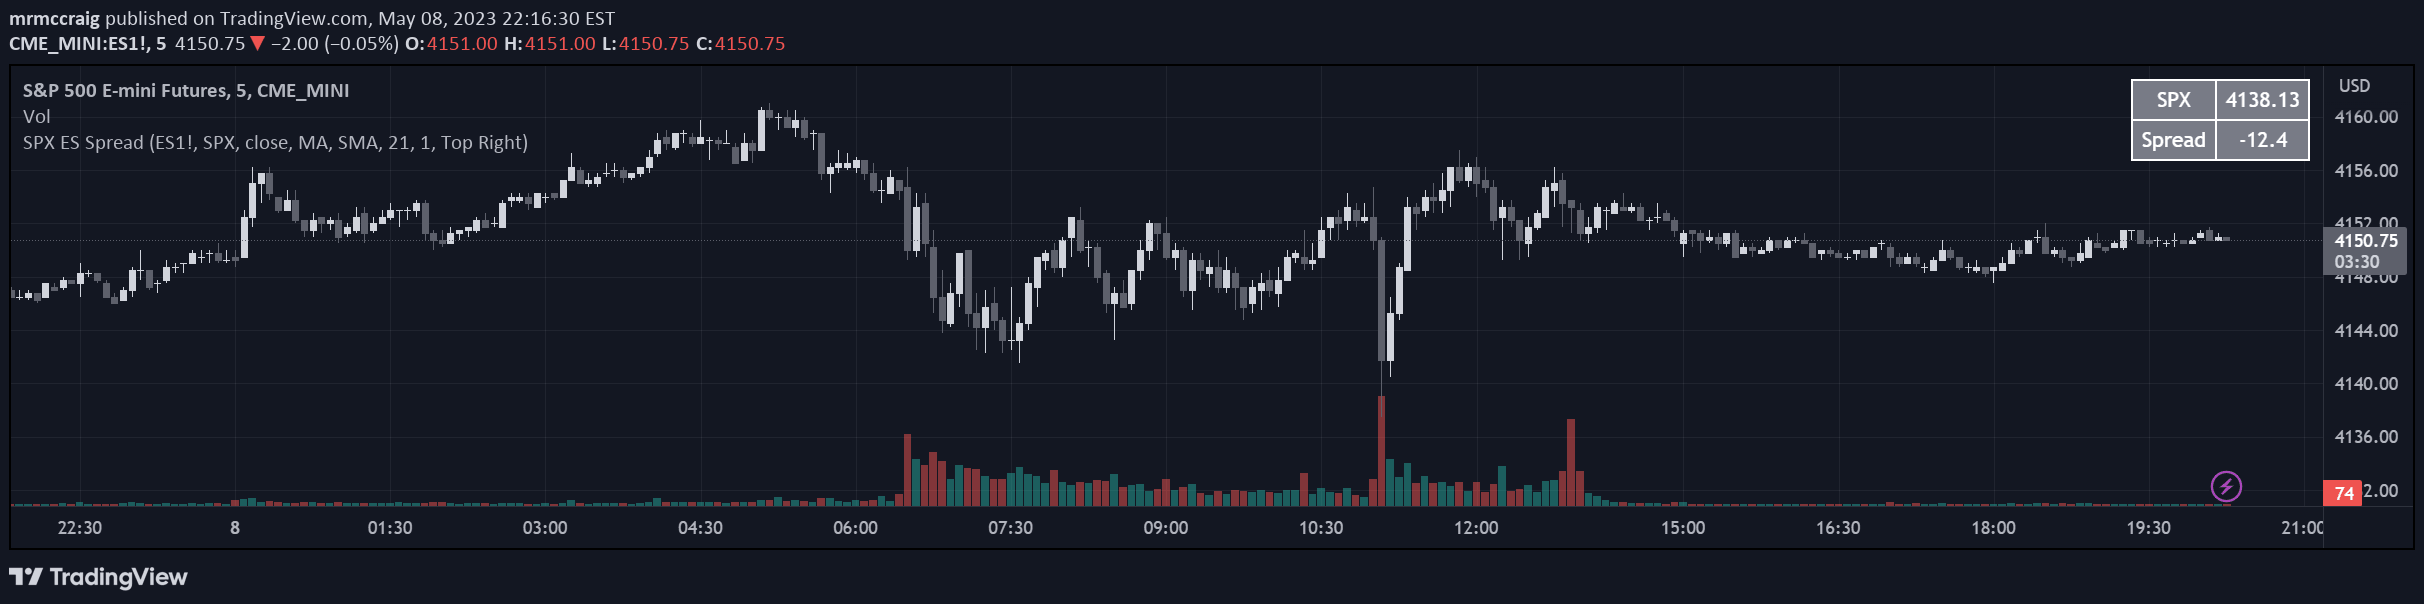
A specialized indicator displaying the price spread between ES and SPX indices, providing real-time comparative tracking for traders monitoring these related market instruments.
Explore complementary indicator rolesHow it works
The indicator actively monitors and compares the prices of ES (E-mini S&P 500 futures) and SPX (S&P 500 index) in real-time. When a trader is viewing either the ES or SPX chart, the tool automatically calculates and displays the current price of the other instrument, along with the precise point difference between them.
The table appears strategically positioned in the upper right corner of the chart, ensuring minimal interference with price analysis. Users can customize the specific symbols used, allowing flexibility in tracking different but related market instruments for comparative analysis.
Why it may be useful
This indicator provides traders with an immediate, visual representation of the price relationship between futures and index markets, offering critical insights into market convergence and divergence. By displaying real-time price comparisons, traders can quickly identify potential arbitrage opportunities or discrepancies between related financial instruments.
The tool's ability to show point differences enables traders to make more informed decisions, understanding how futures and cash markets are interacting. This comparative view can help in developing more nuanced trading strategies that leverage the subtle relationships between different but correlated market instruments.
When to explore it
The ES and SPX spread indicator is most valuable during active trading hours when both markets are liquid and responsive. Traders focused on index-based strategies, particularly those dealing with S&P 500 related instruments, will find this tool especially useful for immediate comparative analysis.
It is particularly beneficial for day traders and scalpers who need rapid, precise information about market relationships. The indicator becomes most powerful when used in conjunction with other technical analysis tools, helping traders understand broader market dynamics and potential trading opportunities.
Keep exploring
What we’ve verified
Access, alerts and repainting behaviour have not been independently verified for this indicator. Check the creator’s current publication and settings.
General descriptions and classifications are recovered research. Verified details above identify the specific checks we have completed. Check the creator’s current publication for later changes.