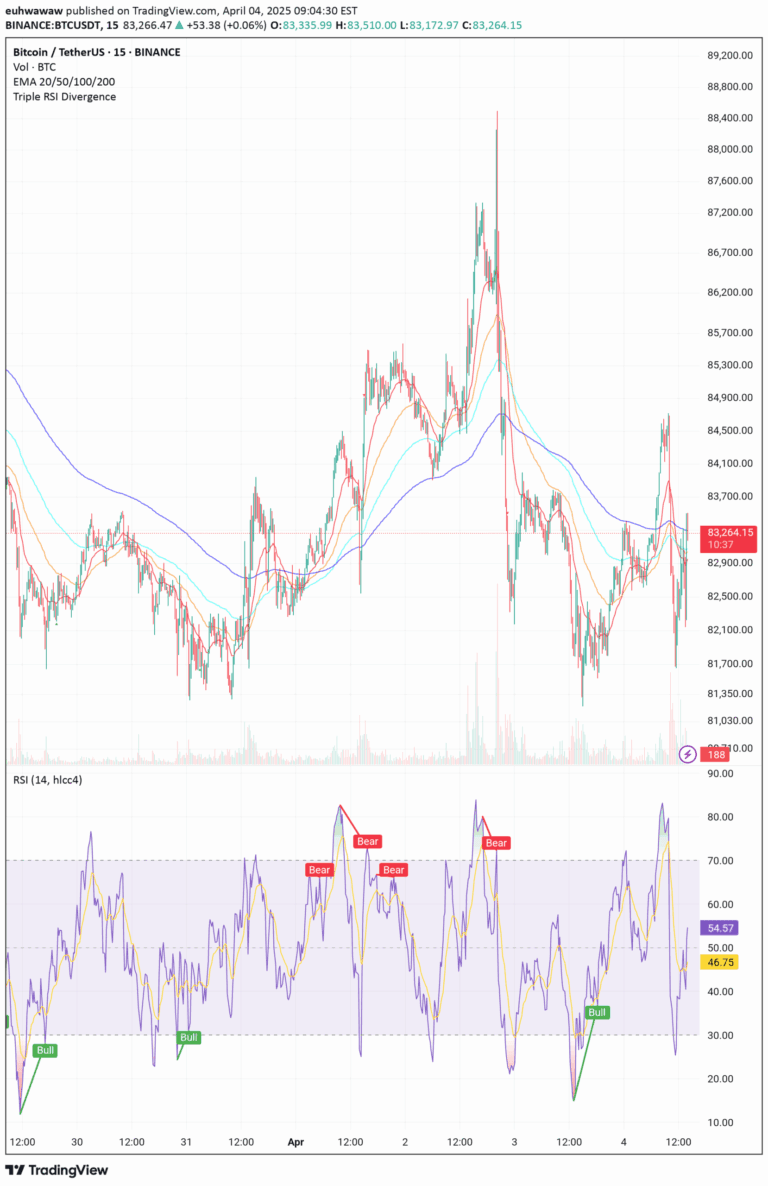
RSI between currencies calculates relative strength, revealing comparative performance across different currency pairs. The indicator uses color-coding to visually represent strength levels above or below 50.
Explore complementary indicator rolesHow it works
The Relative Strength Index (RSI) between currencies measures the momentum and comparative performance of different currency pairs. By calculating the average gains and losses over a specific period, the indicator generates a numerical value between 0 and 100.
When comparing multiple currencies, the RSI helps traders understand which currencies are performing stronger or weaker relative to each other. The color-coding system provides an immediate visual representation, with red backgrounds indicating RSI values of 50 or higher and blue backgrounds representing values below 50.
Why it may be useful
Currency RSI comparison offers traders a quick and intuitive method to assess relative market strength across different trading pairs. By providing a standardized metric, traders can quickly identify which currencies are experiencing momentum and potential trading opportunities.
The visual color-coding simplifies complex technical analysis, allowing traders to make rapid assessments without extensive numerical interpretation. This approach helps traders quickly screen multiple currency pairs and focus on those showing the most promising momentum characteristics.
When to explore it
The currency RSI comparison works best during periods of high market volatility and when comparing multiple currency pairs simultaneously. Traders should use this indicator when seeking to understand relative currency performance across different markets and timeframes.
It is particularly useful for identifying potential trend shifts, comparing market momentum, and screening for potential trading opportunities. Traders should combine this indicator with other technical and fundamental analysis tools to confirm signals and make more informed trading decisions.
Keep exploring
What we’ve verified
Access, alerts and repainting behaviour have not been independently verified for this indicator. Check the creator’s current publication and settings.
General descriptions and classifications are recovered research. Verified details above identify the specific checks we have completed. Check the creator’s current publication for later changes.