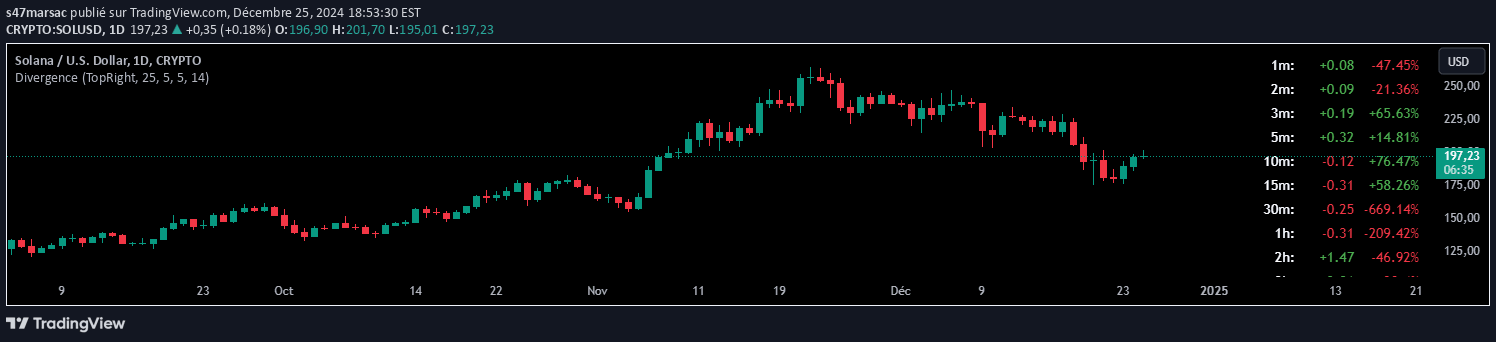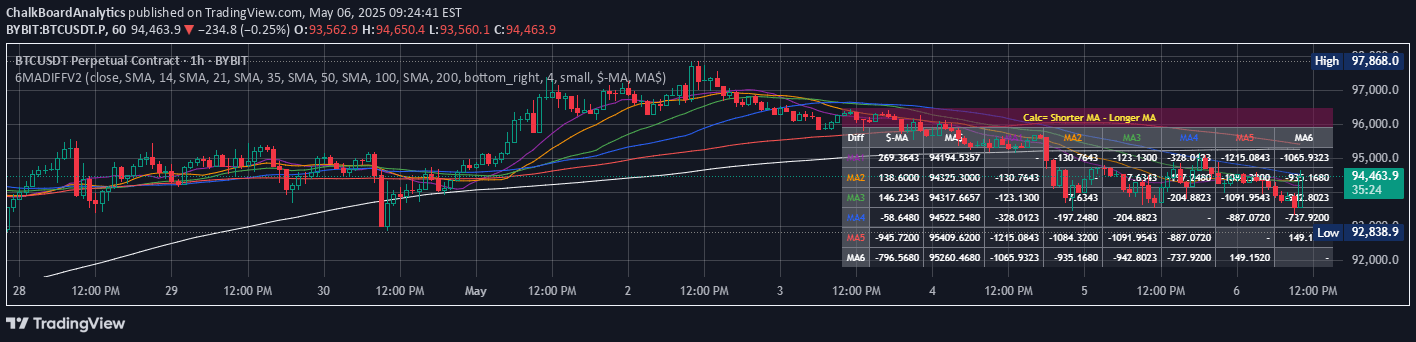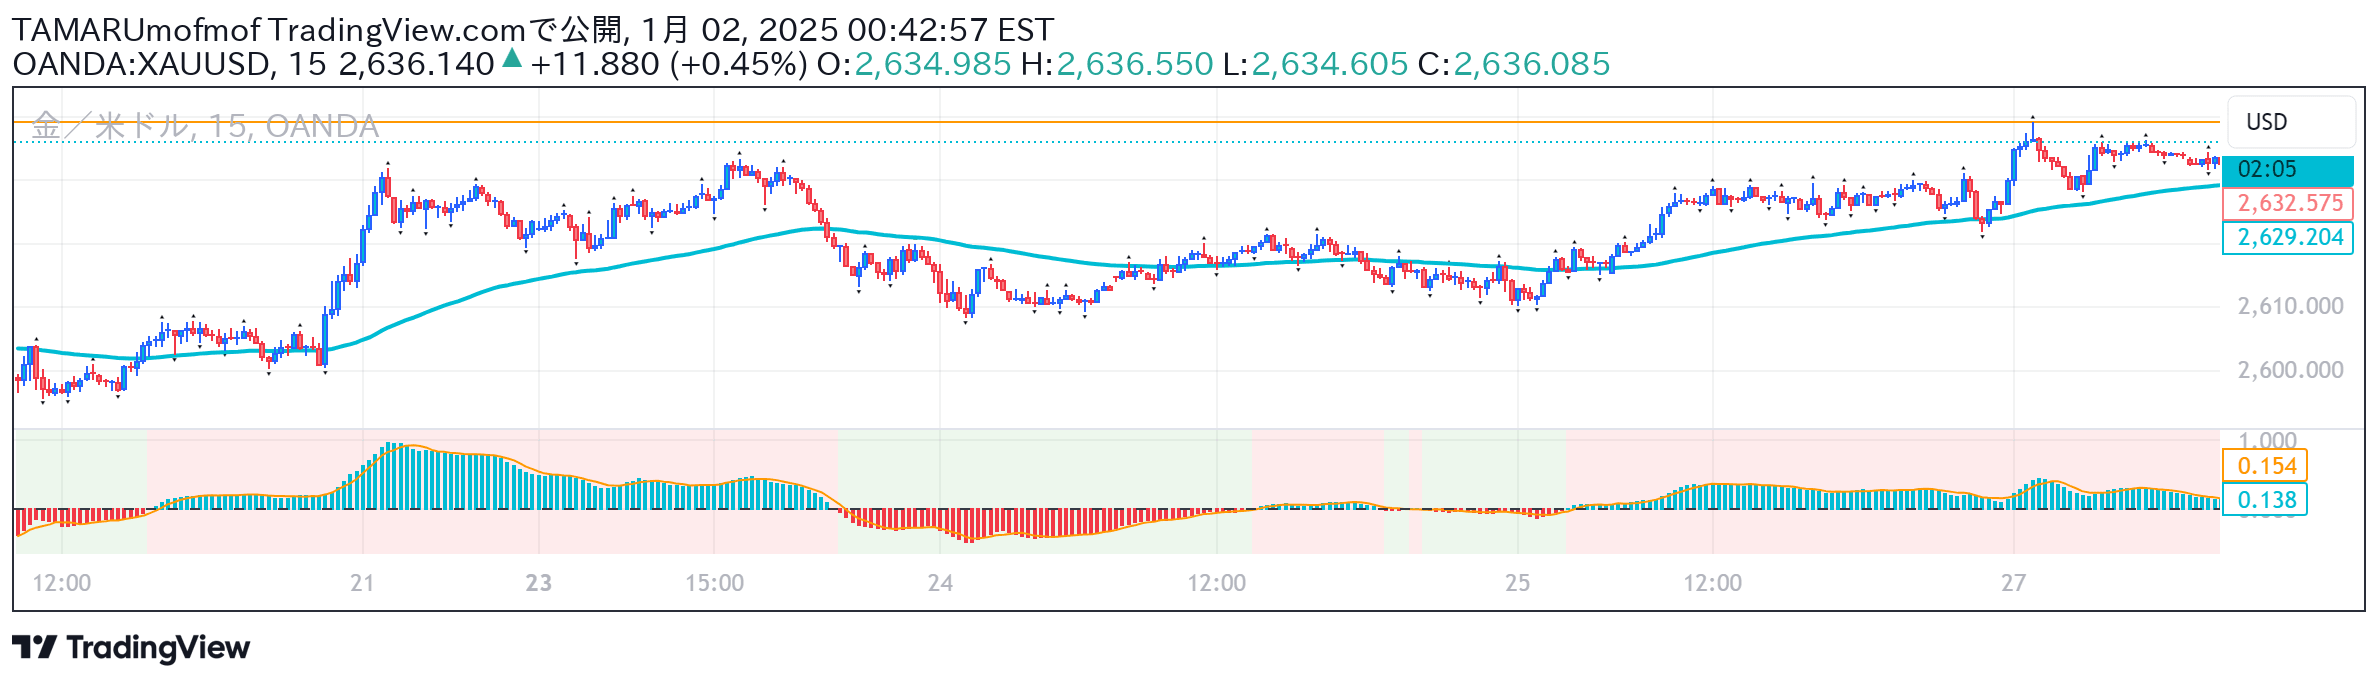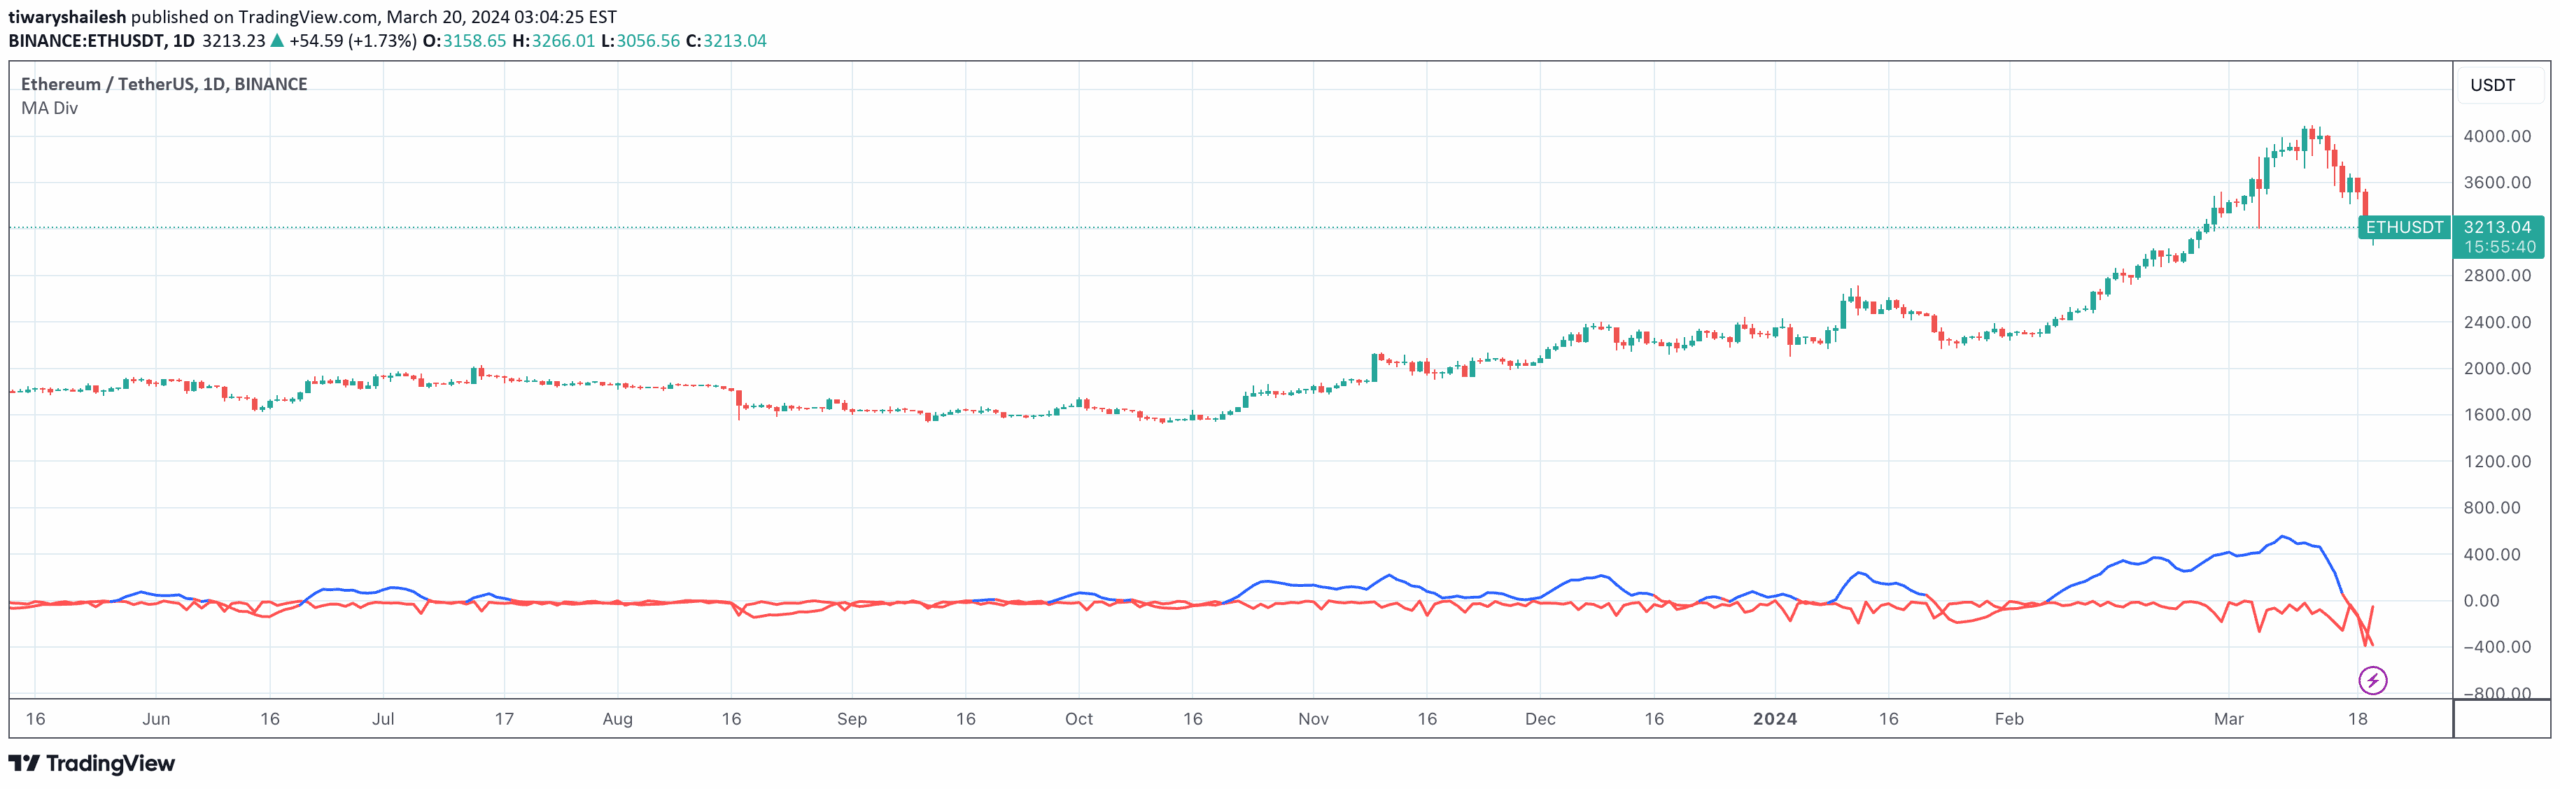
A trading signal that compares divergences between 3-period and 20-period moving averages, plotting color-coded lines to indicate directional momentum and potential trend shifts.
Explore complementary indicator rolesHow it works
The signal calculates two moving averages: a 3-period and a 20-period moving average, tracking the closing prices of price candles. It then computes the divergence between these moving averages, creating comparative lines that illustrate the relationship between short-term and medium-term price momentum. The calculation involves tracking the difference between the current candle's high and the 3-period moving average close, and another line showing the divergence between the 3-period and 20-period moving average closes.
These divergence lines are plotted dynamically, changing color based on their positive or negative values. A blue line indicates a positive divergence, suggesting bullish momentum, while a red line suggests a negative divergence and potential bearish sentiment. Traders can use these color-coded lines to quickly assess the current trend's strength and potential directional changes.
Why it may be useful
This signal provides traders with a nuanced view of price momentum by comparing different timeframe moving averages. It helps identify subtle shifts in market sentiment that might not be immediately apparent from raw price action. By visualizing the relationship between short-term and medium-term price movements, traders can gain insights into potential trend reversals or continuations.
The color-coded divergence lines offer an intuitive, quick-glance method for understanding market dynamics. Traders can quickly interpret the signal's visual representation to make more informed decisions about entry and exit points, potentially reducing the complexity of trend analysis.
When to explore it
The signal is most effective in markets with clear trending characteristics, such as forex, stocks, and cryptocurrency markets. It works best during periods of moderate volatility where moving averages can effectively capture price momentum. Traders should use this signal in conjunction with other technical analysis tools to confirm potential trade setups and reduce false signals.
The indicator is particularly useful for short-term trading strategies like scalping and day trading, where quick identification of momentum shifts is crucial. It may be less reliable in highly erratic or sideways markets where price movements are less directional. Combining this signal with volume indicators or other trend-confirmation tools can enhance its predictive accuracy.
Keep exploring
What we’ve verified
Access, alerts and repainting behaviour have not been independently verified for this indicator. Check the creator’s current publication and settings.
General descriptions and classifications are recovered research. Verified details above identify the specific checks we have completed. Check the creator’s current publication for later changes.