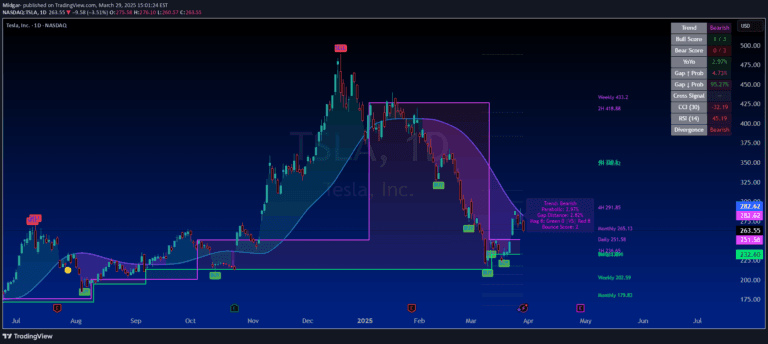
Supercloud is a dynamic moving average trend representation that uses multiple MA's referenced to EMA 200 to analyze price movement and trend strength across different timeframes.
Explore complementary indicator rolesHow it works
Supercloud generates a unique trend visualization by calculating the difference between price movements across multiple moving averages, all referenced to the EMA 200. The cloud starts at zero and rises or falls based on price action, with different colors and volumes indicating trend strength and momentum.
The indicator uses MA-5 as a reference point for cloud outlines, creating bright green or red edges depending on price position. The cloud's color and volume provide visual cues about the current market trend, with green indicating upward movement and red signaling downward momentum.
Why it may be useful
Supercloud provides traders with a comprehensive visual representation of market trends that goes beyond traditional moving average indicators. By integrating multiple moving averages and creating a dynamic cloud, it offers a more nuanced view of price momentum and trend strength across different timeframes.
The indicator's unique design allows traders to quickly assess market conditions, identify potential trend reversals, and make more informed trading decisions. Its adaptability across various timeframes makes it a versatile tool for different trading styles and market environments.
When to explore it
Supercloud is most effective in markets with clear trending characteristics, where price movements are more predictable and sustained. It works particularly well in liquid markets with sufficient price volatility, such as major currency pairs, stock indices, and actively traded commodities.
Traders should use Supercloud when seeking a comprehensive trend analysis tool that provides visual clarity about market direction, momentum, and potential reversal points. It is especially useful during periods of consistent market movement and when combined with other technical analysis tools for confirmation.
Keep exploring
What we’ve verified
Access, alerts and repainting behaviour have not been independently verified for this indicator. Check the creator’s current publication and settings.
General descriptions and classifications are recovered research. Verified details above identify the specific checks we have completed. Check the creator’s current publication for later changes.