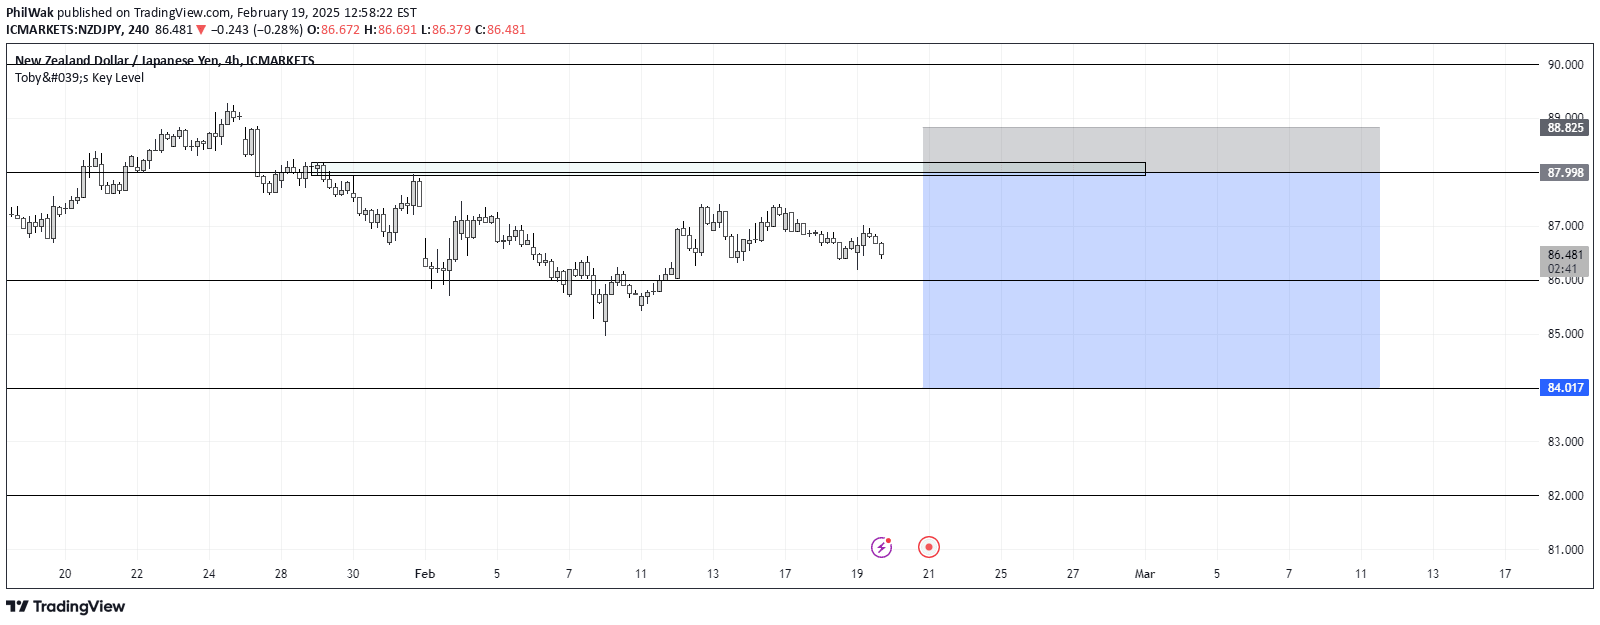
A non-repainting support and resistance indicator that identifies critical price zones dynamically. Helps traders pinpoint key market levels with customizable visual alerts and precise zone detection.
Explore complementary indicator rolesHow it works
The indicator detects pivot highs and lows using a specified lookback period, creating dynamic support and resistance zones. It continuously analyzes price action to identify critical levels where market movements are likely to pause or reverse.
Once a pivot point is confirmed, the tool draws corresponding zones using TradingView's drawing tools. These zones remain active until price breaks through them or they expire based on a predefined maximum duration, ensuring real-time and accurate visual representation of market structure.
Why it may be useful
Support and resistance zones are crucial for understanding market psychology and potential price reversal points. By identifying these key levels, traders can make more informed decisions about entry, exit, and risk management strategies.
The non-repainting feature ensures traders receive reliable signals without the uncertainty of constantly changing indicators. This provides a more stable and trustworthy method of analyzing market dynamics and potential trading opportunities.
When to explore it
This indicator is most effective in markets with clear trend structures and consistent price movements. Traders can benefit most when applying it to liquid markets like major forex pairs, stock indices, and prominent cryptocurrencies.
It works particularly well during periods of consolidation and when price is testing significant support or resistance levels. Traders should combine this tool with other technical analysis methods to confirm signals and improve overall trading decision-making.
Keep exploring
What we’ve verified
Access, alerts and repainting behaviour have not been independently verified for this indicator. Check the creator’s current publication and settings.
General descriptions and classifications are recovered research. Verified details above identify the specific checks we have completed. Check the creator’s current publication for later changes.