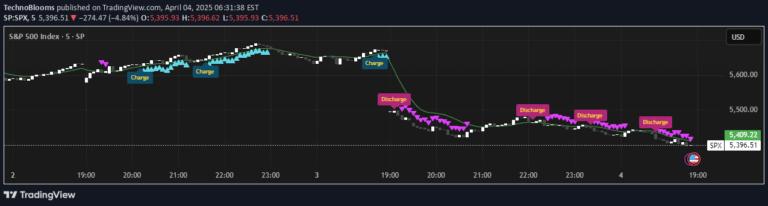
A technical analysis tool combining Sweep and Cement candle patterns with Exponential Moving Averages to identify potential market trend reversals and continuations.
Explore complementary indicator rolesHow it works
The indicator first analyzes candle patterns by identifying unique Sweep and Cement formations that signal potential trend changes. It specifically looks for price movements where the current candle's low is lower than the previous candle's low for bullish signals, or the high is higher than the previous candle's high for bearish signals.
Simultaneously, the indicator calculates three Exponential Moving Averages (EMAs) with different lengths to provide trend context. When these EMAs align in a specific configuration and the candle pattern confirms a potential move, the indicator generates visual signals and alerts for traders to consider entry or exit points.
Why it may be useful
This indicator provides traders with a multi-layered approach to market analysis by combining price action patterns with trend confirmation through moving averages. It helps traders identify potential trend reversals and momentum shifts more accurately than traditional single-method approaches.
By integrating candle pattern recognition with EMA analysis, traders can gain deeper insights into market dynamics, reducing the likelihood of false signals and improving overall trading decision-making processes.
When to explore it
The Sweep + Cement Candle Coloring with EMA Indicator works best in markets with clear trending characteristics, such as stocks, forex, and cryptocurrency markets. It is particularly effective during periods of moderate to high volatility where price movements are more pronounced and directional.
Traders should use this indicator in conjunction with other technical and fundamental analysis tools to validate signals and manage risk effectively. It is most suitable for traders who prefer a systematic and visually intuitive approach to identifying potential trading opportunities.
Keep exploring
What we’ve verified
Access, alerts and repainting behaviour have not been independently verified for this indicator. Check the creator’s current publication and settings.
General descriptions and classifications are recovered research. Verified details above identify the specific checks we have completed. Check the creator’s current publication for later changes.