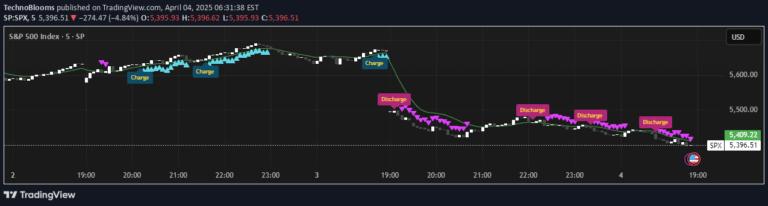
A humorous trading script that generates non-traditional investment advice labels every 23 bars, creating entertaining chart annotations without serious financial guidance.
Explore complementary indicator rolesHow it works
The script operates on a systematic placement mechanism triggered every 23 bars on a trading chart. It determines label content by calculating the remainder when the current bar number is divided by 10, which ensures a pseudo-random yet structured approach to generating annotations.
This algorithmic method creates a predictable yet varied sequence of humorous labels that appear at regular intervals. The underlying logic ensures each label is generated through a mathematical calculation, providing a consistent but entertaining overlay to the trading visualization.
Why it may be useful
The script serves as a lighthearted approach to demystifying trading charts by introducing comedic elements into typically serious financial visualizations. It provides entertainment value by transforming standard trading interfaces into platforms for unexpected humor.
By creating unexpected and amusing annotations, the script challenges the traditional perception of financial analysis as purely serious and data-driven. It offers traders and investors a momentary reprieve from intense market scrutiny, reminding users that not everything in trading needs to be approached with extreme gravity.
When to explore it
This script is best utilized in contexts where humor and levity are desired around financial charting and analysis. It works excellently as a comedic tool to break tension during intense trading sessions or to provide comic relief in professional financial environments.
The script is most effective when used among colleagues or in settings where a playful approach to market visualization can help reduce stress and create a more relaxed atmosphere. It should never be considered a serious trading tool, but rather a creative way to inject personality into otherwise standardized financial representations.
Keep exploring
What we’ve verified
Access, alerts and repainting behaviour have not been independently verified for this indicator. Check the creator’s current publication and settings.
General descriptions and classifications are recovered research. Verified details above identify the specific checks we have completed. Check the creator’s current publication for later changes.