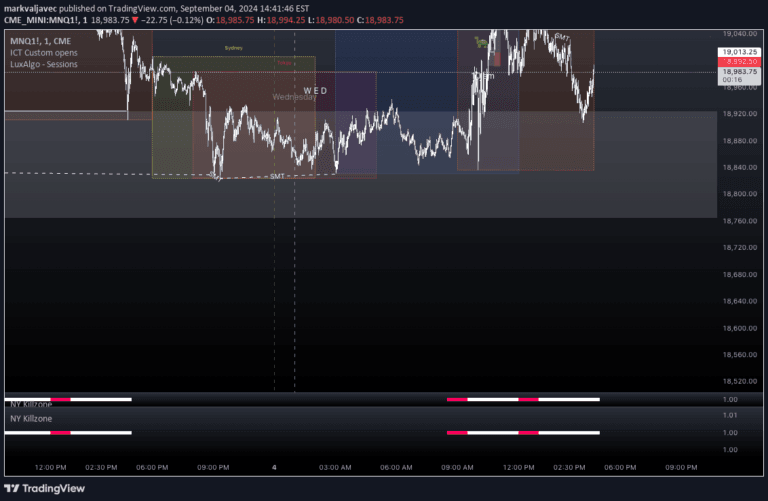
Timeframe Marker helps traders visualize multiple timeframe transitions on lower timeframe charts, displaying stacked bars to indicate different timeframe boundaries.
Explore complementary indicator rolesHow it works
The Timeframe Marker operates by displaying color-coded bars representing different timeframe boundaries on lower timeframe charts. Traders can select multiple timeframes in ascending order, starting from the lowest timeframe, with each additional bar representing a larger timeframe in a different color.
The indicator uses a predefined set of timeframes including 5 minutes (green), 15 minutes (yellow), 1 hour (orange), 4 hour (red), daily (blue), weekly (purple), and monthly (gray). It dynamically adjusts bar visibility based on the current chart timeframe to prevent visual clutter.
Why it may be useful
Timeframe Marker provides critical visual context for traders operating on lower timeframes, helping them understand larger market structure and potential trend shifts. By displaying multiple timeframe boundaries simultaneously, traders can make more informed decisions about market momentum and potential trend changes.
The indicator helps traders avoid tunnel vision by offering a broader perspective of market dynamics across different timeframes. This comprehensive view enables more strategic entry and exit points, reducing the risk of trading against larger market trends.
When to explore it
Timeframe Marker is most effective when trading on lower timeframes like 1-minute or 5-minute charts, where understanding larger timeframe context is crucial. Traders can use this tool to identify potential trend changes, support and resistance levels, and market sentiment across multiple timeframe perspectives.
The indicator is particularly useful for day traders and scalpers who need rapid insights into market structure. By providing clear visual markers for different timeframe transitions, traders can make more precise and timely trading decisions based on a holistic view of market movements.
Keep exploring
What we’ve verified
Access, alerts and repainting behaviour have not been independently verified for this indicator. Check the creator’s current publication and settings.
General descriptions and classifications are recovered research. Verified details above identify the specific checks we have completed. Check the creator’s current publication for later changes.