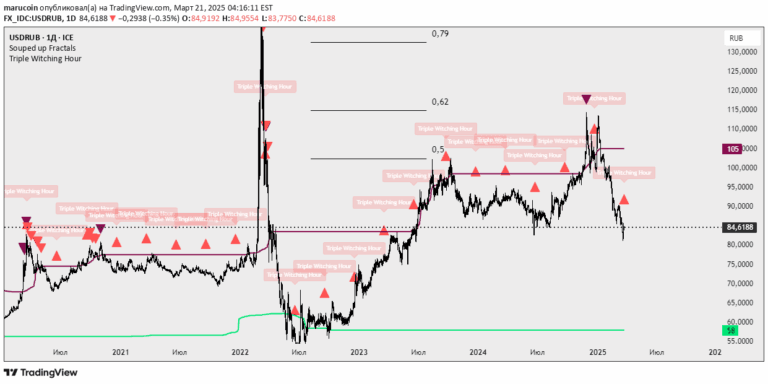
A trading sessions indicator that draws smart boxes representing key market trading hours, allowing customization of session times, colors, and visibility across multiple timeframes.
Explore complementary indicator rolesHow it works
The Trading Sessions Indicator creates visual boxes on the chart representing specific market trading sessions, with default settings covering Asian, Frankfurt, London, and New York sessions in UTC+3 time. Users can precisely configure each session's timing, enabling or disabling specific session displays and customizing box colors to suit their trading preferences.
The indicator operates across multiple timeframes from 1 minute to 1 hour, with optimal performance recommended on 5-minute charts. By generating smart boxes, traders can quickly identify and visualize different global market trading periods, helping them understand potential market dynamics and liquidity changes throughout the day.
Why it may be useful
Trading sessions are critical for understanding market behavior, as different global exchanges operate at varying times with distinct liquidity and volatility characteristics. This indicator provides traders with a visual representation of these key trading periods, helping them make more informed decisions about market entry and exit points.
By offering customizable settings, the tool adapts to individual trading styles and preferences, making it versatile for forex and cryptocurrency markets. The ability to quickly recognize session boundaries helps traders anticipate potential market movements and align their strategies with the most active trading periods.
When to explore it
The Trading Sessions Indicator is most effective when trading forex and cryptocurrency markets, where global session overlaps can create significant price movements and liquidity changes. Traders can use this tool to identify optimal trading windows, understand potential market volatility, and plan their trading strategies around key session timings.
It is particularly useful for traders who operate across multiple time zones or need to track international market activities. By providing a clear visual representation of trading sessions, the indicator helps traders avoid low-liquidity periods and focus on times when market activity and potential trading opportunities are at their peak.
Keep exploring
What we’ve verified
Access, alerts and repainting behaviour have not been independently verified for this indicator. Check the creator’s current publication and settings.
General descriptions and classifications are recovered research. Verified details above identify the specific checks we have completed. Check the creator’s current publication for later changes.