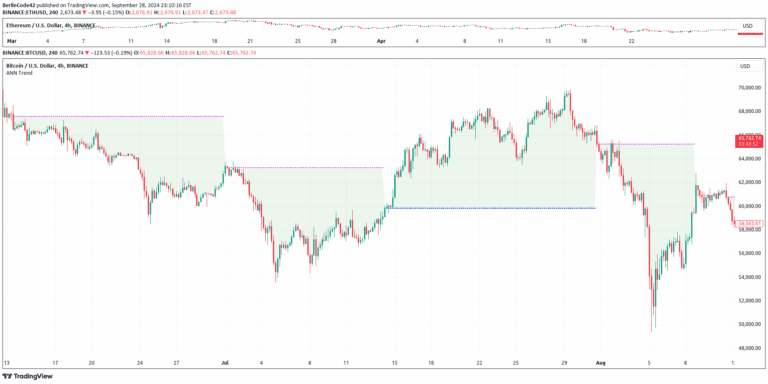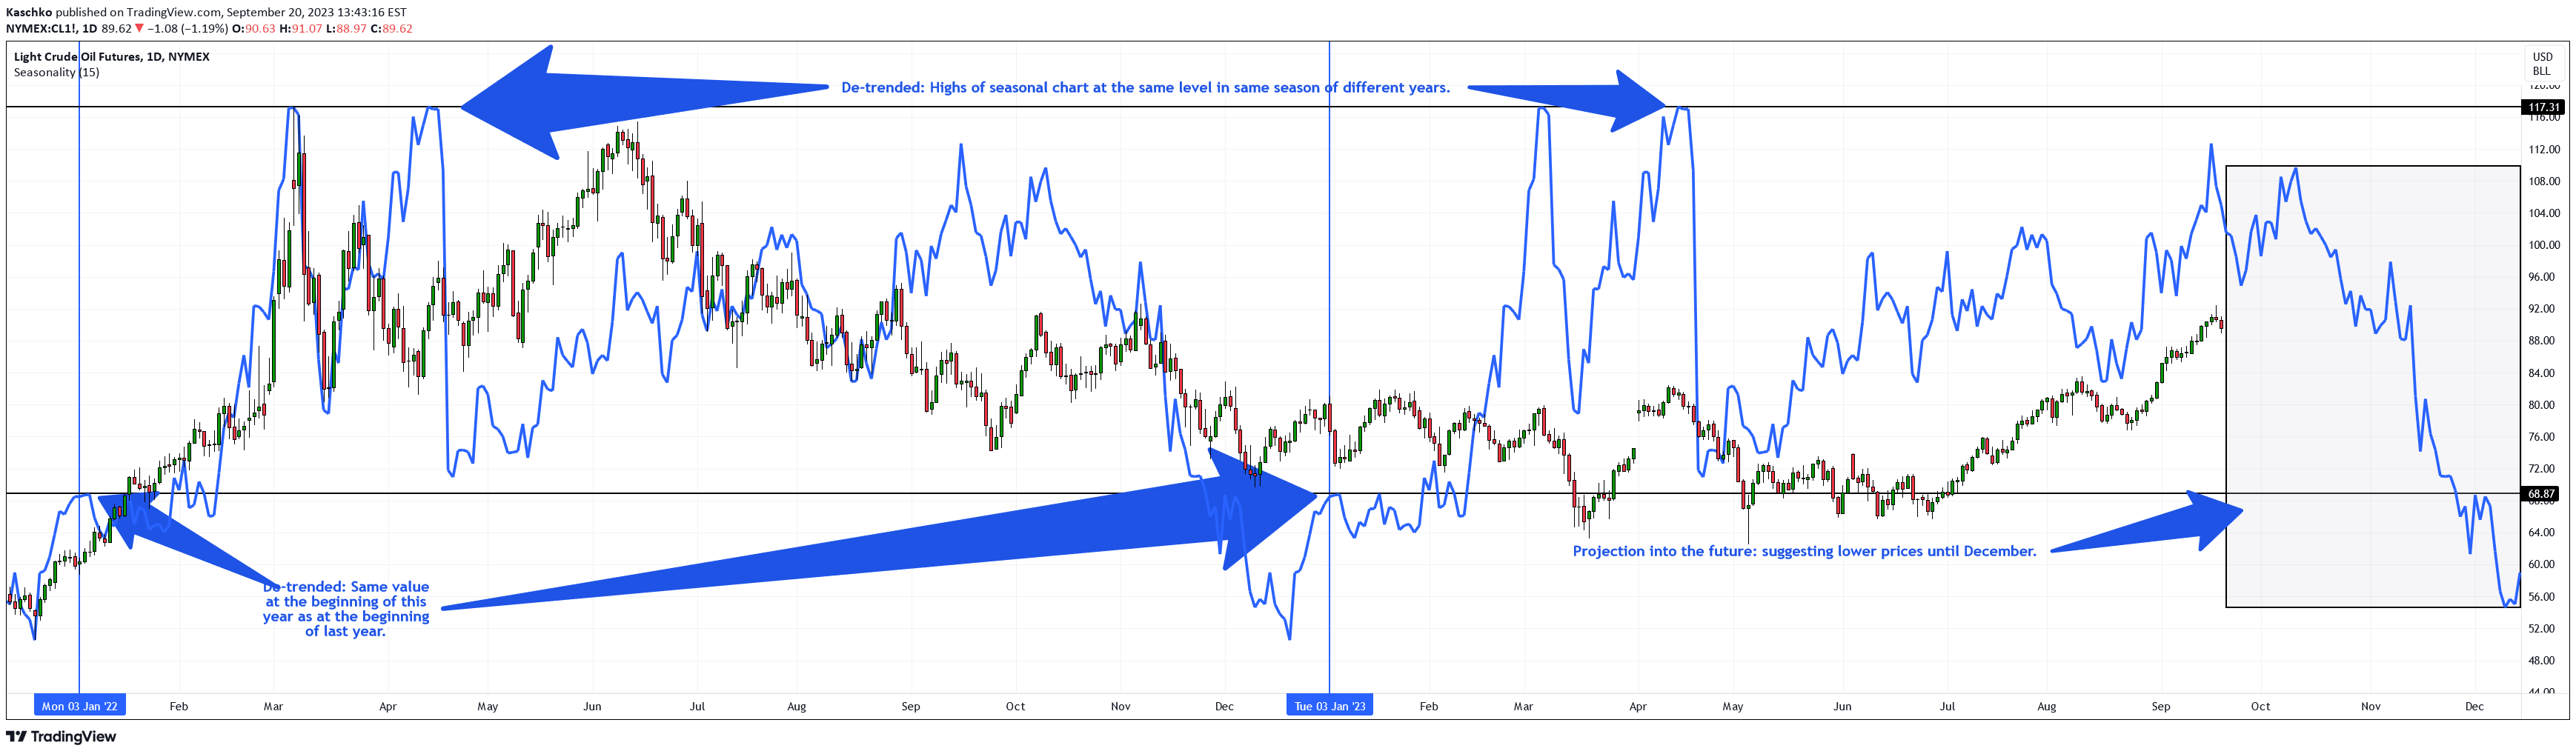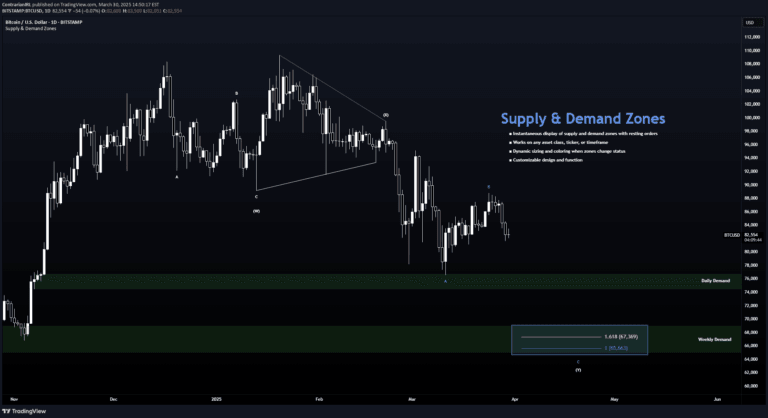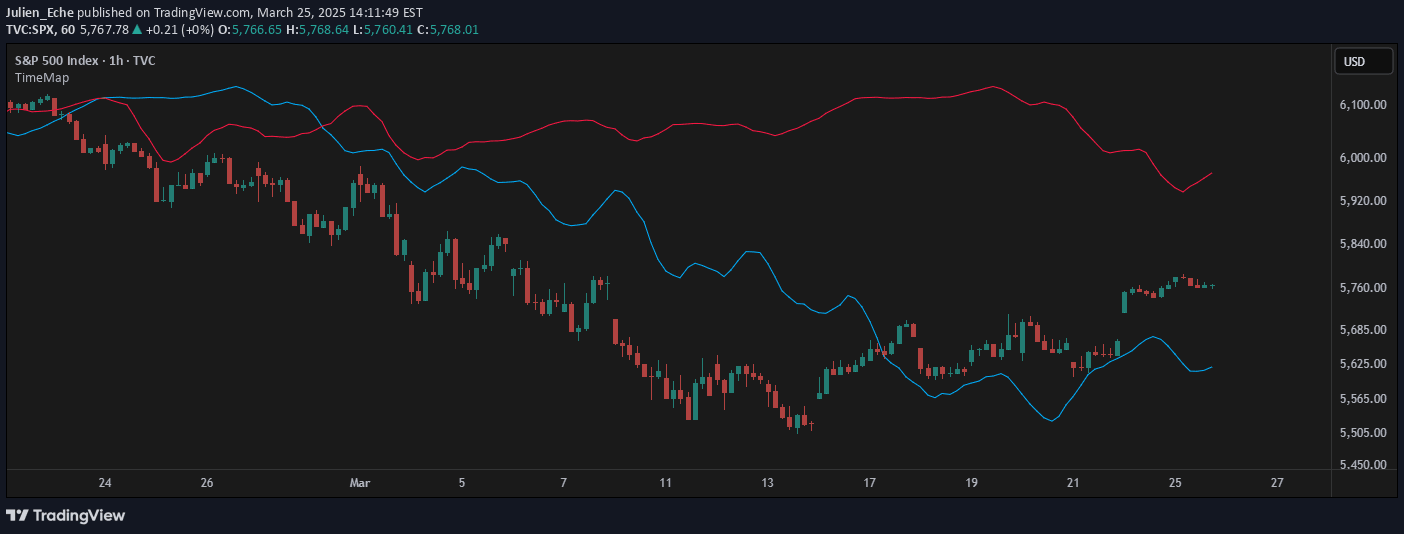
TimeMap is a visual price-reference indicator that plots historical closing prices from various timeframes to help traders quickly understand current price positioning relative to past market structure.
Explore complementary indicator rolesHow it works
TimeMap calculates precise historical bars for weekly, monthly, quarterly, semi-annual, and annual intervals, dynamically adjusting based on chart timeframe and market type. It plots horizontal reference lines representing past closing prices directly on the chart.
The indicator considers different market types like stocks, crypto, forex, and futures, accounting for specific trading session characteristics. It can include extended trading hours for intraday analysis and offers optional smoothing through a Simple Moving Average to reduce line volatility
Why it may be useful
This indicator helps traders rapidly visualize price context by providing immediate reference to historical market structure. By displaying closing prices from different time periods, traders can quickly identify trends, support and resistance levels, and potential price reversal zones.
The flexible configuration allows adaptation to various trading styles and market types. It provides a comprehensive view of price positioning across short, medium, and long-term timeframes without requiring complex manual calculations
When to explore it
TimeMap is most effective when traders want to understand current price positioning relative to historical context. It works best in markets with consistent trading patterns and sufficient historical data.
Traders can leverage this tool during trend identification, determining potential support/resistance levels, and assessing overall market sentiment. It is particularly useful for day traders and swing traders who need quick visual references across multiple timeframes
Keep exploring
What we’ve verified
Access, alerts and repainting behaviour have not been independently verified for this indicator. Check the creator’s current publication and settings.
General descriptions and classifications are recovered research. Verified details above identify the specific checks we have completed. Check the creator’s current publication for later changes.