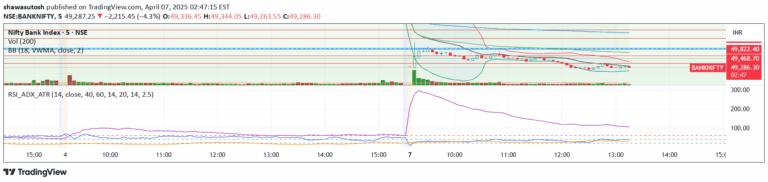
A real-time volatility tracking tool that measures session and instant market movement through Average True Range (ATR), providing traders with quick insights into market conditions.
Explore complementary indicator rolesHow it works
The Session and Instant Volatility Ticker calculates the Average True Range (ATR) across historical trading sessions, specifically focusing on a defined time window like 0200-0600. It computes the standard deviation of true range values to provide a comprehensive volatility metric. The tool continuously streams current ATR values, updating in real-time with each market tick.
By tracking both historical and current volatility, traders receive a dynamic representation of market movement. The ticker displays key volatility information including session ATR with one standard deviation, current ATR, previous true range, and remaining time in the current price bar.
Why it may be useful
Volatility is crucial for traders to understand market dynamics and manage risk effectively. This tool provides immediate insights into price fluctuations, helping traders make more informed decisions about potential trade entry and exit points. By understanding current market volatility, traders can adjust their strategies and position sizing accordingly.
The real-time nature of the ticker allows for quick assessment of market conditions, enabling traders to adapt rapidly to changing price movements. It serves as a critical risk management tool, helping traders determine whether current market volatility aligns with their trading plan and risk tolerance.
When to explore it
The Session and Instant Volatility Ticker is most effective during periods of potential market transition or uncertainty. Traders can utilize this tool during market open, significant economic announcements, or when transitioning between trading sessions. It provides valuable context for understanding market behavior across different timeframes and trading environments.
Particularly useful for short-term traders like scalpers and day traders, this tool helps assess whether current market conditions support their trading strategy. Traders can use the volatility information to make real-time decisions about trade entry, stop-loss placement, and overall risk management.
Keep exploring
What we’ve verified
Access, alerts and repainting behaviour have not been independently verified for this indicator. Check the creator’s current publication and settings.
General descriptions and classifications are recovered research. Verified details above identify the specific checks we have completed. Check the creator’s current publication for later changes.