
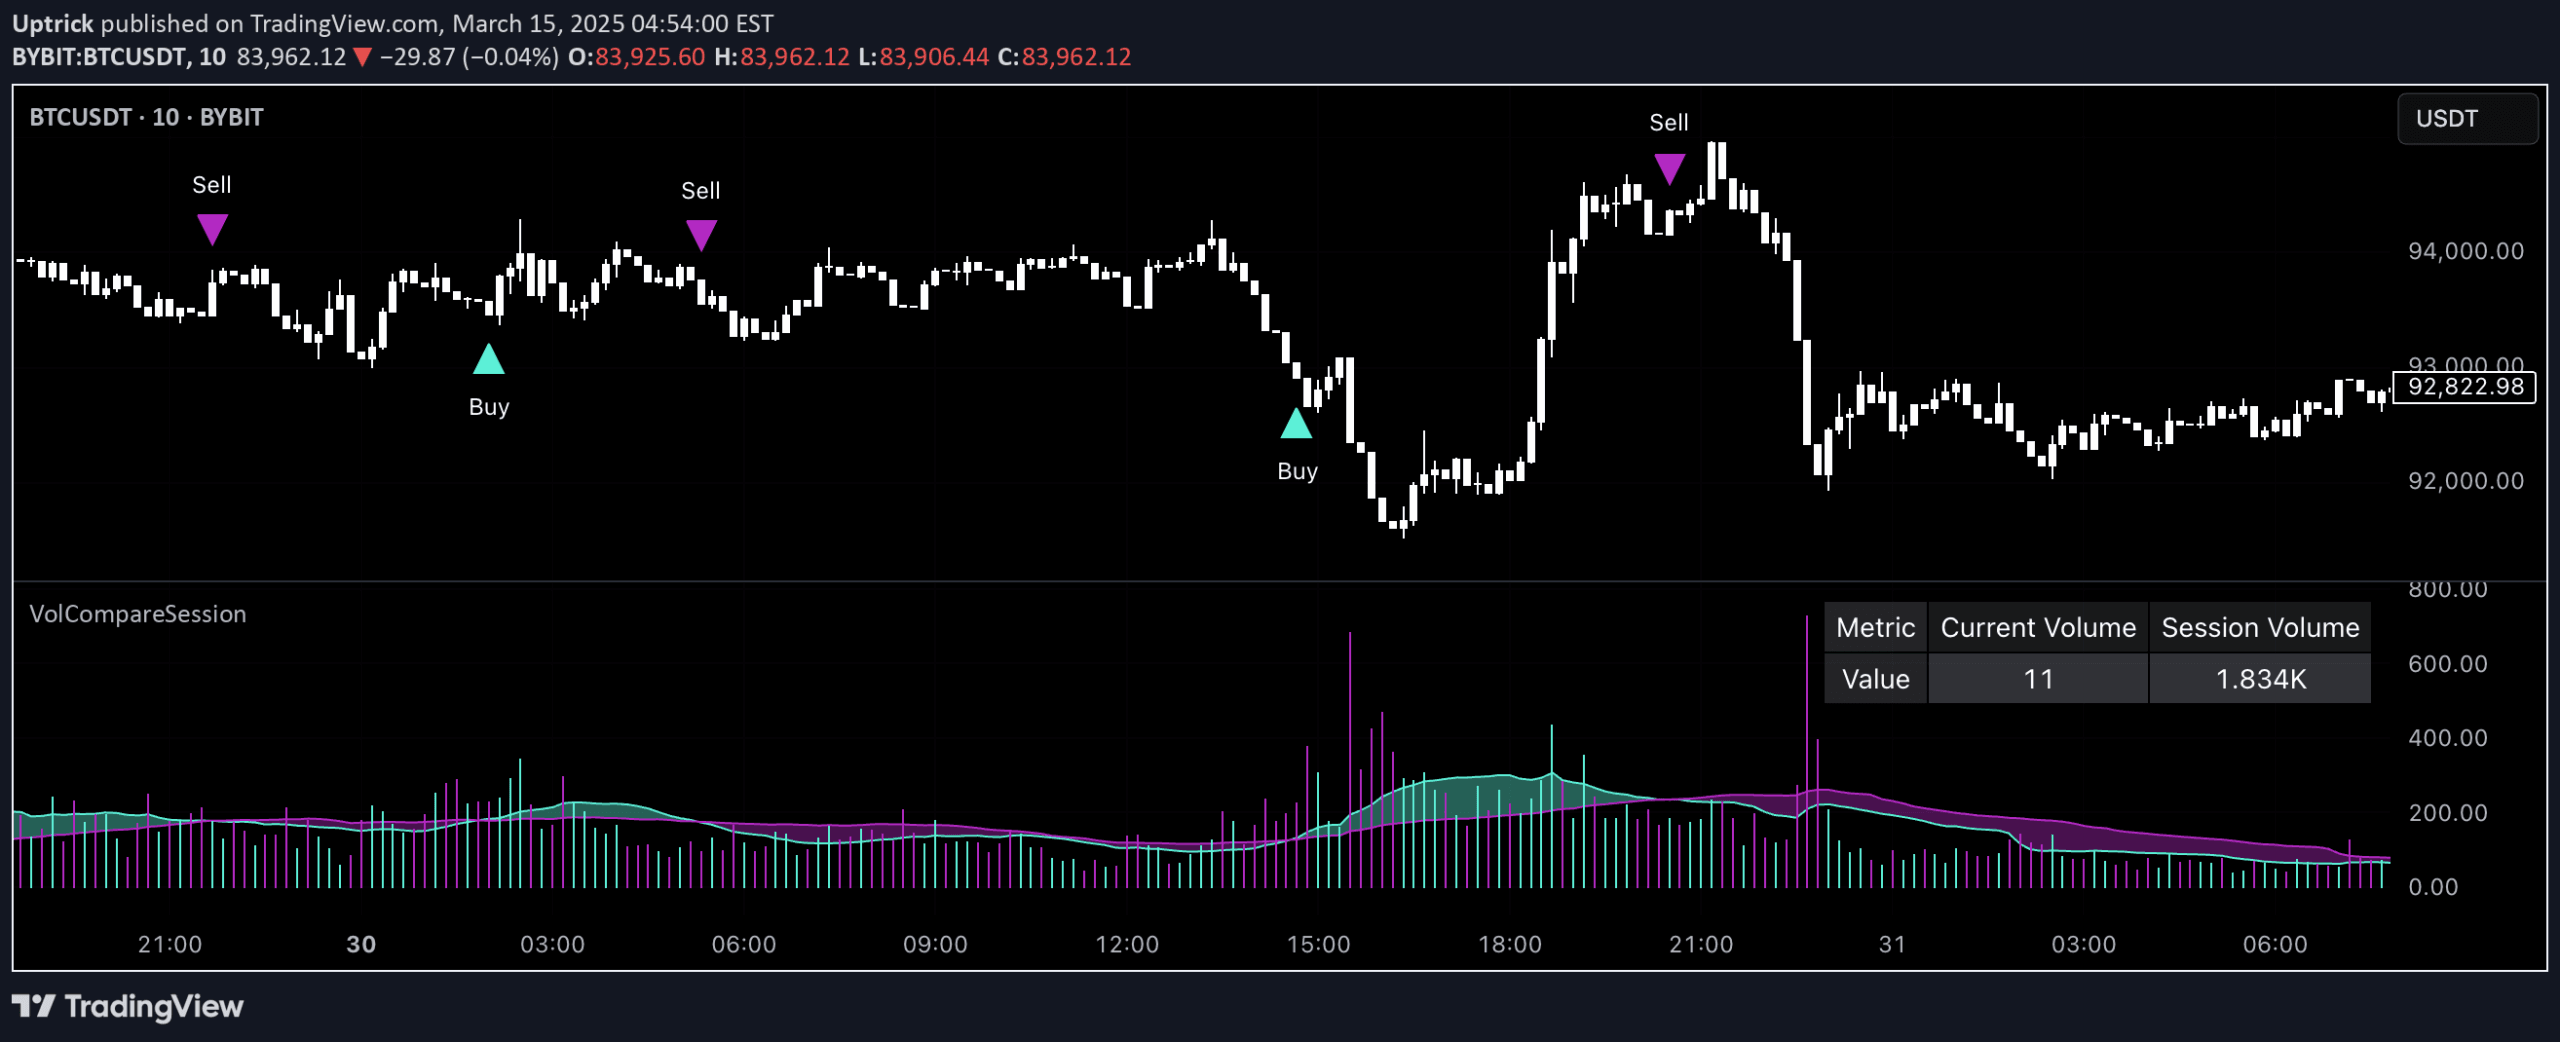
Volume Strength indicator evaluates market liquidity by analyzing volume bars against a custom threshold, providing insights into trading pressure and potential price movements.
Explore complementary indicator rolesHow it works
The Volume Strength indicator calculates volume dynamics by comparing current trading volume to a predefined threshold and historical average. It tracks volume bars, differentiating between up and down bars to assess market sentiment and liquidity levels.
By analyzing volume direction and intensity, the indicator assigns color-coded bars to represent buying or selling pressure. Green bars indicate upward movement, while red bars signify downward pressure, with notable volume spikes highlighted to emphasize significant trading activity.
Why it may be useful
Volume Strength provides traders with critical insights into market liquidity and potential price movements by quantifying trading activity beyond simple price analysis. It helps traders understand the underlying momentum and strength of market trends by revealing the intensity of buying and selling pressures.
By offering a visual representation of volume dynamics, the indicator enables traders to make more informed decisions about market conditions, potential trend reversals, and the reliability of current price movements.
When to explore it
The Volume Strength indicator is most effective in markets with significant trading activity and clear volume patterns, such as stocks, futures, and forex markets with high liquidity. Traders can utilize this tool during periods of market volatility to confirm trend strength and potential price reversals.
It works best when combined with other technical indicators to validate signals and provide a comprehensive market analysis. Traders should pay special attention to volume spikes that deviate from the average, as these can indicate potential trend changes or significant market events.
Keep exploring
What we’ve verified
Access, alerts and repainting behaviour have not been independently verified for this indicator. Check the creator’s current publication and settings.
General descriptions and classifications are recovered research. Verified details above identify the specific checks we have completed. Check the creator’s current publication for later changes.


