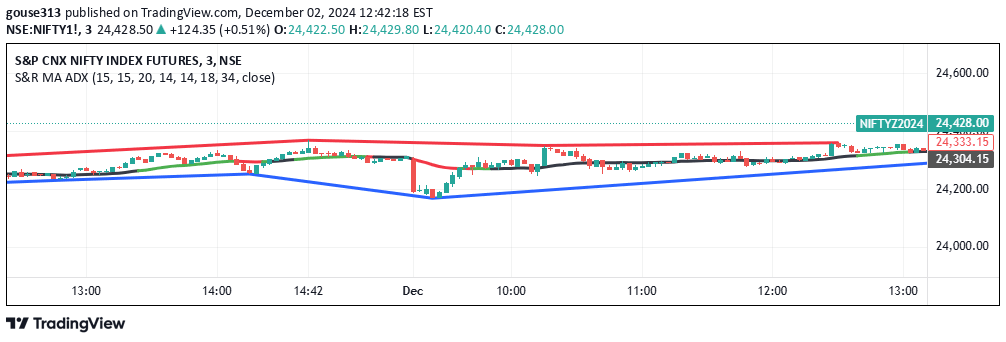
A dynamic US market support and resistance indicator that plots key levels at market open and identifies trend direction using color-coded shading between support and resistance lines.
Explore complementary indicator rolesHow it works
The indicator identifies the US market open time and plots support and resistance levels based on the first candle's high and low. These lines are extended infinitely across the chart, creating a visual framework for understanding potential price movement boundaries.
As the price trades throughout the day, the area between the support and resistance levels is dynamically shaded to indicate the current trend. Green shading indicates an uptrend when price is above resistance, red shading indicates a downtrend when price is below support, and gray shading suggests a sideways trend when price is between the levels.
Why it may be useful
This indicator provides traders with a clear, visual representation of market structure and trend direction immediately after the US market opens. By establishing key support and resistance levels from the first candle, traders can quickly understand the potential market sentiment and directional bias.
The color-coded shading and trend dashboard offer an intuitive way to assess market conditions, helping traders make more informed decisions about potential entry and exit points. It simplifies complex market analysis by presenting trend information in an easily digestible format.
When to explore it
The indicator is most effective on timeframes between 5 and 30 minutes, specifically during US market hours. It is particularly useful for traders seeking to understand initial market sentiment and potential trend direction after the market opens.
Traders should avoid using this indicator during periods of significant economic news releases, as sudden price fluctuations can create false signals. It is recommended to combine this indicator with other technical analysis tools to confirm trends and make more robust trading decisions.
Keep exploring
What we’ve verified
Access, alerts and repainting behaviour have not been independently verified for this indicator. Check the creator’s current publication and settings.
General descriptions and classifications are recovered research. Verified details above identify the specific checks we have completed. Check the creator’s current publication for later changes.