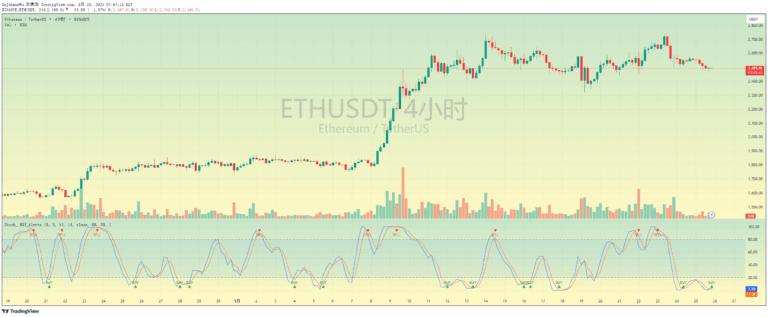
A Stochastic RSI indicator analyzing USDT/USD momentum to detect early market sentiment shifts and potential trend reversals in cryptocurrency markets.
Explore complementary indicator rolesHow it works
The USDTUSD Stochastic RSI calculates the Relative Strength Index (RSI) on USDT/USD closing prices, then applies a stochastic oscillator to this RSI value. This process transforms the standard RSI into a more dynamic momentum indicator that fluctuates between 0 and 100.
By analyzing the momentum of USDT, a critical intermediary in crypto transactions, the indicator reveals underlying market liquidity and sentiment shifts. It can be smoothed using Simple Moving Average (SMA) or Exponential Moving Average (EMA), allowing traders to customize the sensitivity of the signal.
Why it may be useful
This indicator provides a unique structural perspective on market dynamics by focusing on USDT's momentum instead of direct price movements. It offers insights into capital flow and market sentiment that traditional price-based indicators might miss, serving as a leading indicator for potential Bitcoin price reversals.
By observing USDT/USD momentum, traders can anticipate market turning points before they become apparent in price charts. This approach allows for a more proactive trading strategy, enabling traders to read the market's underlying intentions rather than simply reacting to price movements.
When to explore it
The USDTUSD Stochastic RSI is most effective during periods of market transition or when seeking early signals of potential trend reversals. It works best when combined with other analytical tools like on-chain data or macro indicators to confirm its signals and provide a comprehensive market analysis.
Traders should look for moments when the indicator bottoms out or peaks, as these often precede similar movements in Bitcoin's price. By overlaying this indicator with Bitcoin's price chart, traders can identify potential entry and exit points with greater precision and confidence.
Keep exploring
What we’ve verified
Access, alerts and repainting behaviour have not been independently verified for this indicator. Check the creator’s current publication and settings.
General descriptions and classifications are recovered research. Verified details above identify the specific checks we have completed. Check the creator’s current publication for later changes.