
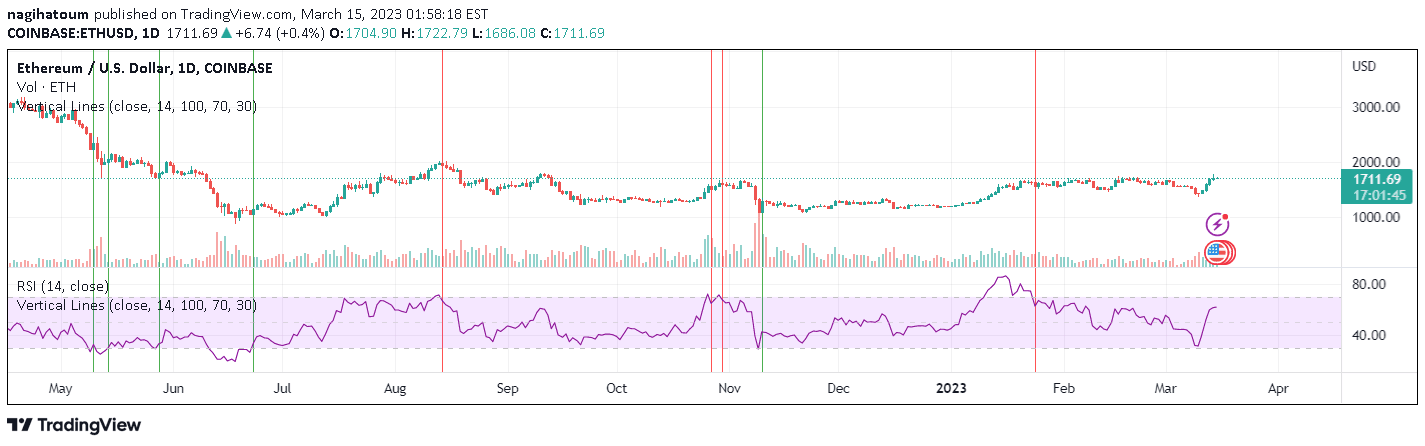
A custom PineScript technique for plotting vertical lines on charts using RSI crossovers, providing visual indicators of overbought and oversold market conditions.
Explore complementary indicator rolesHow it works
The script utilizes a creative method to generate vertical lines on trading charts by manipulating the plotcandle function. By setting open and close prices to be identical and using the wick as a line, it creates a unique vertical line visualization technique for tracking indicator movements.
The primary mechanism involves calculating RSI values for current and previous bars, then identifying crossover points in overbought and oversold zones. When RSI crosses predefined thresholds (typically 70 and 30), the script generates color-coded vertical lines to highlight these significant market transitions.
Why it may be useful
Vertical lines provide traders with instant visual cues about critical market transitions, allowing quick identification of potential trend reversals or momentum shifts. By highlighting RSI crossover points, traders can more easily recognize when an asset might be overbought or oversold, enabling more informed trading decisions.
The script's flexibility allows adaptation to various indicators beyond RSI, making it a versatile tool for technical analysis. Its ability to generate clear, immediate visual signals helps traders quickly interpret complex market data and potentially improve their entry and exit strategies.
When to explore it
This vertical line plotting technique is most effective in volatile markets with clear trending or oscillating price movements. It works best with indicators like RSI that have well-defined overbought and oversold zones, providing clear signals during market transitions.
Traders should consider using this technique in markets with consistent momentum and when seeking to identify potential trend reversals. It is particularly useful for short to medium-term trading strategies that rely on quick identification of market sentiment changes.
Keep exploring
What we’ve verified
Access, alerts and repainting behaviour have not been independently verified for this indicator. Check the creator’s current publication and settings.
General descriptions and classifications are recovered research. Verified details above identify the specific checks we have completed. Check the creator’s current publication for later changes.



