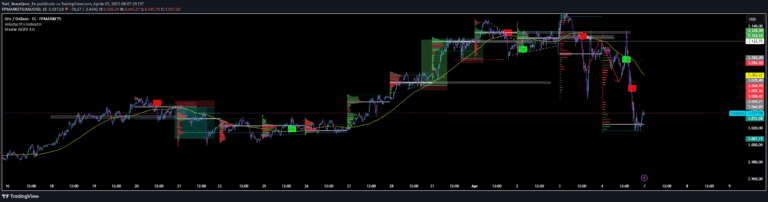
A volume analysis tool that visualizes buying and selling pressure across price levels, helping traders identify market dynamics and significant trading zones.
Explore complementary indicator rolesHow it works
The Volume Positive & Negative Levels indicator calculates volume dynamics by analyzing price action across a 500-bar lookback period. It categorizes volume as positive (buying pressure) when the close price is higher than the open, and negative (selling pressure) when the close is lower than the open.
The indicator creates a volume profile histogram that plots volume levels at different price points, using color-coded bars to distinguish between buying and selling pressure. Users can customize the analysis by setting volume thresholds and adjusting the number of bins for more granular insights into market activity.
Why it may be useful
This volume analysis tool provides traders with a comprehensive view of market sentiment by revealing where significant buying and selling activities occur. By visualizing volume distribution across price levels, traders can better understand the underlying strength of price movements and potential market reversals.
The color-coded visualization and interactive labels make it easier to identify key support and resistance zones, helping traders make more informed decisions. The dynamic volume calculation offers insights into market psychology, showing where institutional and retail traders are most active.
When to explore it
The Volume Positive & Negative Levels indicator is most effective in markets with clear volume trends and significant price movements. It works best in liquid markets like stocks, forex, and futures, where volume data provides meaningful insights into market dynamics.
Traders should utilize this tool during periods of market transitions, such as potential trend reversals, breakouts, or consolidation phases. It is particularly useful for identifying high-volume price levels that might indicate strong support or resistance zones, helping traders make more strategic entry and exit decisions.
Keep exploring
What we’ve verified
Access, alerts and repainting behaviour have not been independently verified for this indicator. Check the creator’s current publication and settings.
General descriptions and classifications are recovered research. Verified details above identify the specific checks we have completed. Check the creator’s current publication for later changes.