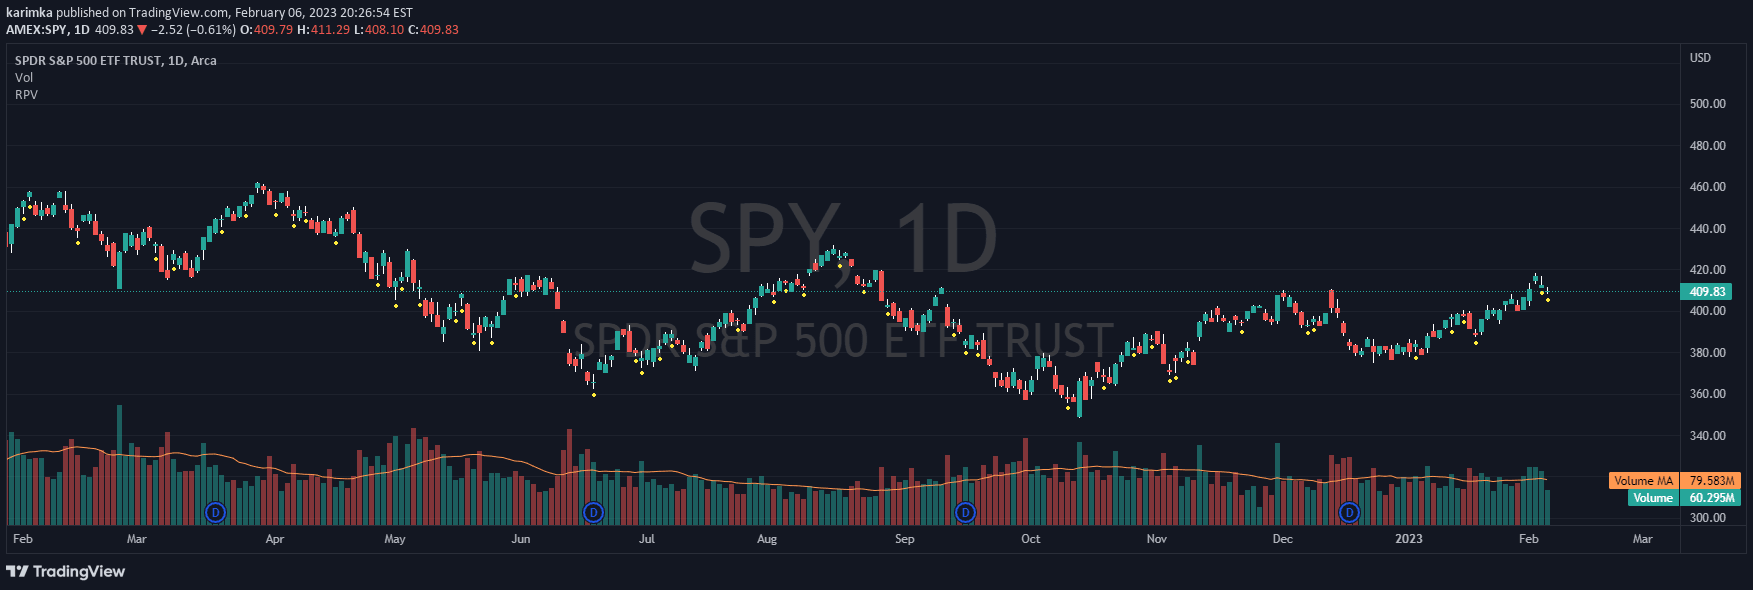
Volume Scale by Price (VSP) is a visual tool that plots trading volume across price levels, allowing traders to analyze volume distribution and intensity across different price ranges.
Explore complementary indicator rolesHow it works
Volume Scale by Price (VSP) works by displaying trading volume as a histogram across different price levels. It segments price ranges and shows volume distribution, with options to customize histogram details. Traders can adjust the number of bars displayed, controlling how many historical periods are represented.
The tool allows modification of histogram width and volume scaling ratio to suit different market conditions and trading styles. By plotting volume against price, it provides a visual representation of trading activity at specific price points. The histogram can be configured to show multiple historical periods, offering insights into volume trends. Each configuration provides a unique perspective on market volume dynamics
Why it may be useful
Volume Scale by Price helps traders understand market sentiment and trading activity at different price levels. It reveals where significant trading volume has occurred, indicating potential support and resistance zones. By visualizing volume distribution, traders can identify price ranges with high trading interest and potential market turning points.
The indicator provides insights into market participation and strength of price movements. It helps traders assess the conviction behind price trends and potential reversal zones. Understanding volume patterns can improve trade entry and exit decisions. The customizable nature of VSP allows traders to adapt the tool to various market conditions and trading strategies
When to explore it
Volume Scale by Price is most effective in markets with clear volume patterns and during periods of established price trends. It works best in liquid markets with consistent trading volume, such as major stock indices, forex pairs, and actively traded commodities. Traders can use VSP during range-bound markets to identify potential breakout levels and volume confirmation.
It is particularly useful when analyzing market transitions, confirming trend strength, and identifying potential reversal zones. The indicator provides valuable insights during consolidation periods and when assessing market sentiment. Traders should combine VSP with other technical analysis tools for comprehensive market analysis. It is most reliable when used across multiple timeframes to validate volume signals
Keep exploring
What we’ve verified
Access, alerts and repainting behaviour have not been independently verified for this indicator. Check the creator’s current publication and settings.
General descriptions and classifications are recovered research. Verified details above identify the specific checks we have completed. Check the creator’s current publication for later changes.