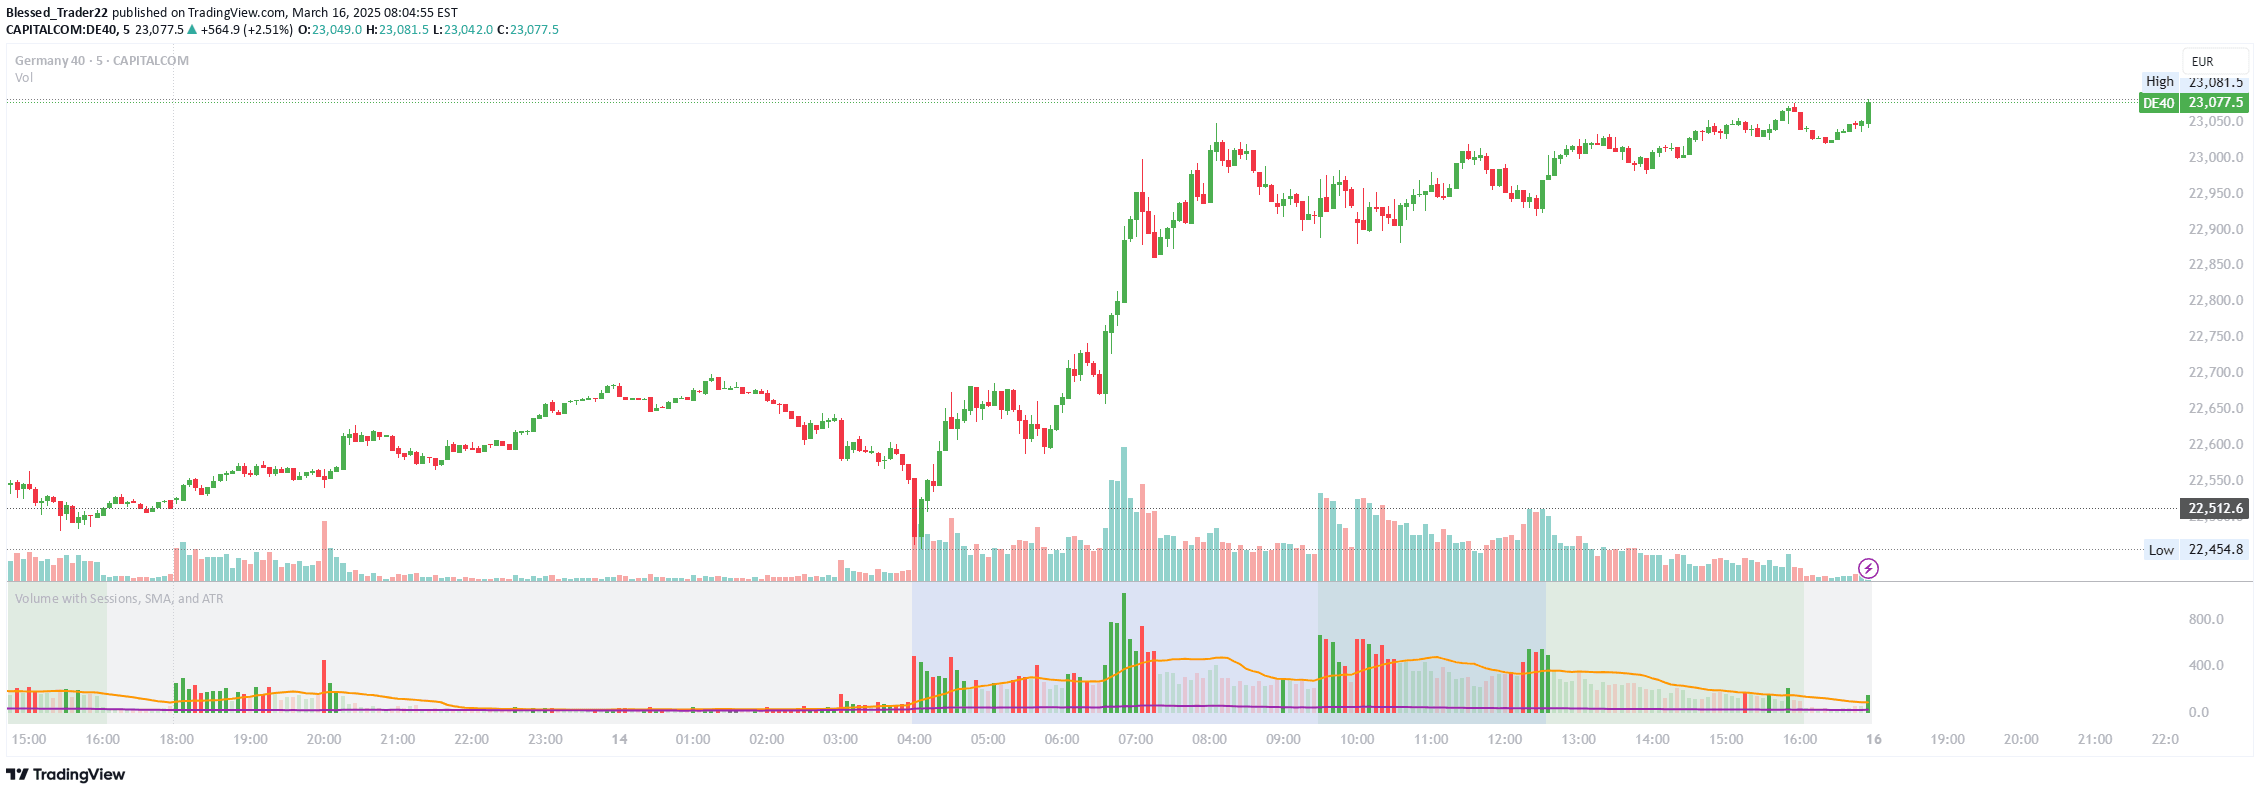
Volume Spectrum Candles is a unique trading indicator that enhances candlestick charts by visually representing trading volume through color gradation, enabling quick market activity analysis.
Explore complementary indicator rolesHow it works
Volume Spectrum Candles operates by dynamically adjusting the color intensity of each candlestick based on the corresponding trading volume. As trade volume increases, the candle's color becomes darker or more saturated, providing an immediate visual cue about market activity levels. The color gradient ranges from light to dark, creating a spectrum that allows traders to quickly assess volume variations across different trading periods.
The mechanism transforms traditional candlestick charts by integrating volume data directly into the candle's visual representation. By eliminating the need for separate volume indicators, traders can simultaneously interpret price action and trading volume through a single, intuitive visualization.
Why it may be useful
Volume Spectrum Candles provides traders with a powerful visual tool that bridges the gap between price movement and trading volume analysis. By incorporating volume intensity directly into candlestick colors, traders can rapidly identify periods of significant market activity without complex calculations or additional chart elements.
This immediate visual feedback helps traders make more informed decisions about potential trend strength and market momentum. The indicator's intuitive design enables traders to quickly recognize subtle volume changes that might otherwise go unnoticed. By transforming raw volume data into an easily digestible color gradient, the tool democratizes complex volume analysis, making it accessible to traders of all experience levels and trading styles.
When to explore it
Volume Spectrum Candles is most effective during periods of market volatility and significant price movements, where understanding trading volume can provide crucial insights into potential trend reversals or continuations. Traders can leverage this tool across various market conditions, from ranging markets to trending environments, to gain a comprehensive understanding of market dynamics and potential trading opportunities.
The indicator proves particularly valuable during key market events, earnings releases, or economic announcements when trading volume tends to spike. By offering an instantaneous visual representation of volume intensity, traders can quickly assess market sentiment and make more strategic entry and exit decisions across different timeframes and asset classes.
Keep exploring
What we’ve verified
Access, alerts and repainting behaviour have not been independently verified for this indicator. Check the creator’s current publication and settings.
General descriptions and classifications are recovered research. Verified details above identify the specific checks we have completed. Check the creator’s current publication for later changes.