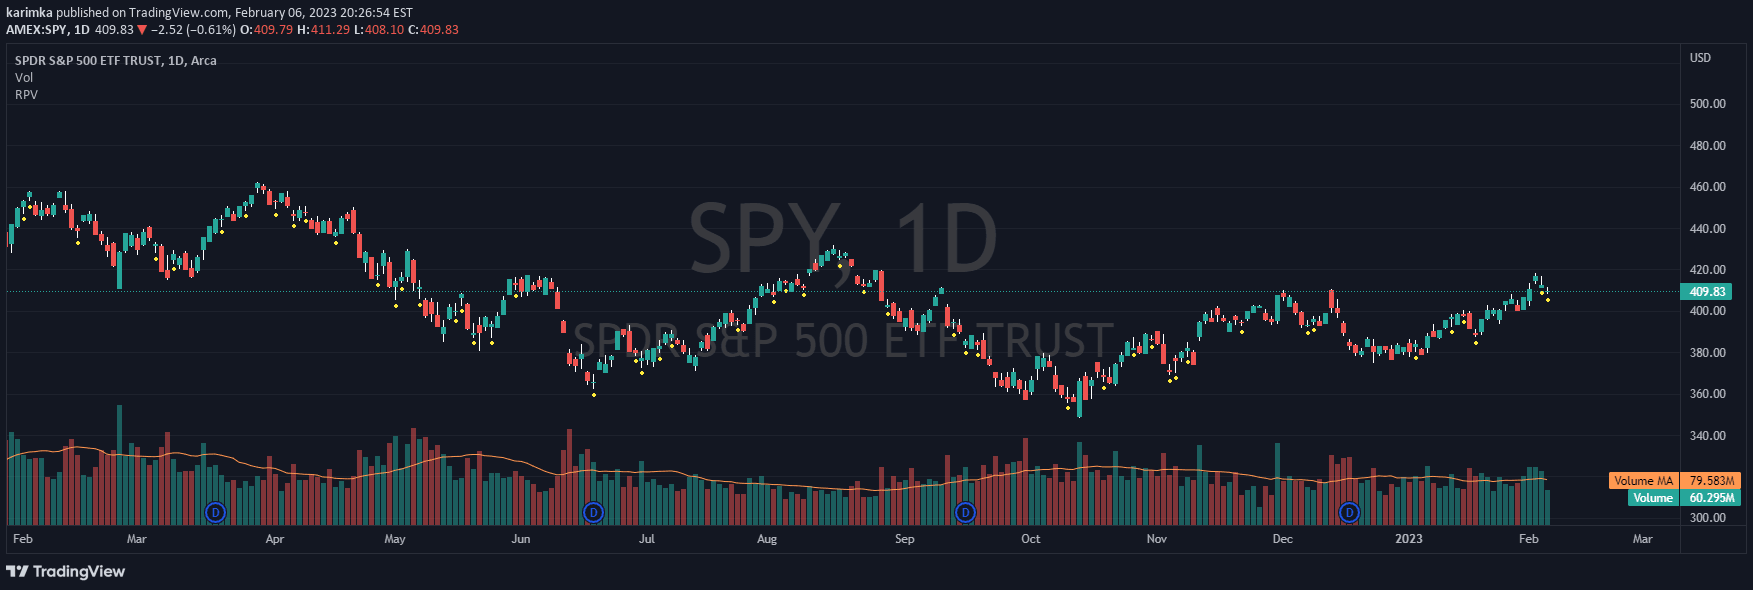
A cutting system that analyzes momentum candle volumes to identify dynamic support and resistance levels by comparing green and red candle transaction volumes across multiple layers.
Explore complementary indicator rolesHow it works
The signal creates multiple vertical cuts from the lowest red momentum price to the highest green momentum price, calculating transaction volumes separately for red and green candles in each layer. It systematically evaluates these layers by analyzing the volume ratios, counting red and green candles, and determining the most significant support and resistance zones.
Traders can customize the maximum number of cuts to refine their analysis, allowing for flexible and precise identification of market structure. The system dynamically checks the current price's relationship to momentum candles and measures the distance between price extremes and the candle's HLC3 (High-Low-Close averaged) value.
Why it may be useful
This signal provides traders with a nuanced approach to understanding market dynamics by transforming raw price and volume data into actionable insights about potential support and resistance levels. By dissecting momentum through volume analysis, traders can gain deeper insights into market sentiment and potential trend reversals.
The methodology's strength lies in its ability to adaptively identify significant market zones based on multiple criteria, offering a more comprehensive view of price action than traditional static support and resistance techniques.
When to explore it
The signal is most effective in markets with clear momentum and distinct volume patterns, making it particularly suitable for liquid and actively traded instruments. It performs best during periods of directional price movement where volume can provide meaningful insights into market sentiment and potential trend continuation or reversal.
Traders should consider using this signal in timeframes that capture meaningful momentum, such as intraday and short-term charts, and be prepared to adjust the cut parameters based on specific market characteristics and trading objectives.
Keep exploring
What we’ve verified
Access, alerts and repainting behaviour have not been independently verified for this indicator. Check the creator’s current publication and settings.
General descriptions and classifications are recovered research. Verified details above identify the specific checks we have completed. Check the creator’s current publication for later changes.