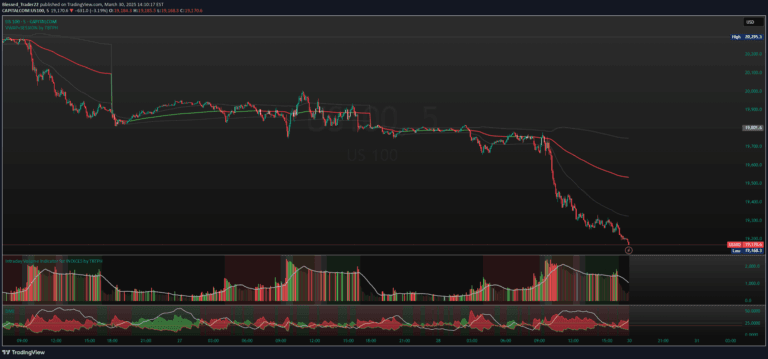
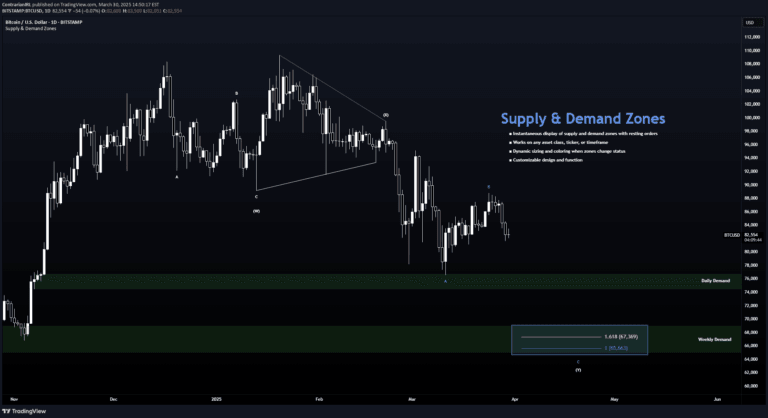
Volume-Time Imbalance (VTI) measures volume intensity relative to time, highlighting unusual trading activity and potential market acceleration or reversal moments.
Explore complementary indicator rolesHow it works
The Volume-Time Imbalance (VTI) calculates volume per second by dividing traded volume by elapsed time between price bars. It creates an exponential moving average of this volume per second metric to establish a smoothed baseline for expected trading activity.
By comparing the current volume per second against this moving average, the VTI generates a ratio that reveals deviations from typical trading patterns. A higher VTI value indicates greater volume intensity relative to expected time-based trading rhythm, signaling potential market acceleration or significant momentum shifts.
Why it may be useful
The VTI provides traders with a dynamic tool to identify unusual trading activity that might precede significant price movements. By quantifying volume intensity relative to time, it offers insights into potential trend changes, market sentiment shifts, and emerging momentum that traditional volume indicators might miss.
Traders can use the VTI to detect early signs of market acceleration, validate trend strength, and anticipate potential reversals before they become obvious through price action alone. Its ability to highlight volume anomalies makes it a valuable supplementary analysis tool for understanding market dynamics.
When to explore it
The VTI works best in actively traded markets with sufficient liquidity, such as major stock indices, forex pairs, and high-volume commodities. It is particularly effective during key market sessions when trading activity is most concentrated, like opening hours or around significant economic announcements.
Traders should combine VTI signals with other technical indicators and price action confirmation to validate potential trading opportunities. It is most reliable when used alongside trend indicators and momentum oscillators to provide a comprehensive view of market conditions and potential entry or exit points.
Keep exploring
What we’ve verified
Access, alerts and repainting behaviour have not been independently verified for this indicator. Check the creator’s current publication and settings.
General descriptions and classifications are recovered research. Verified details above identify the specific checks we have completed. Check the creator’s current publication for later changes.