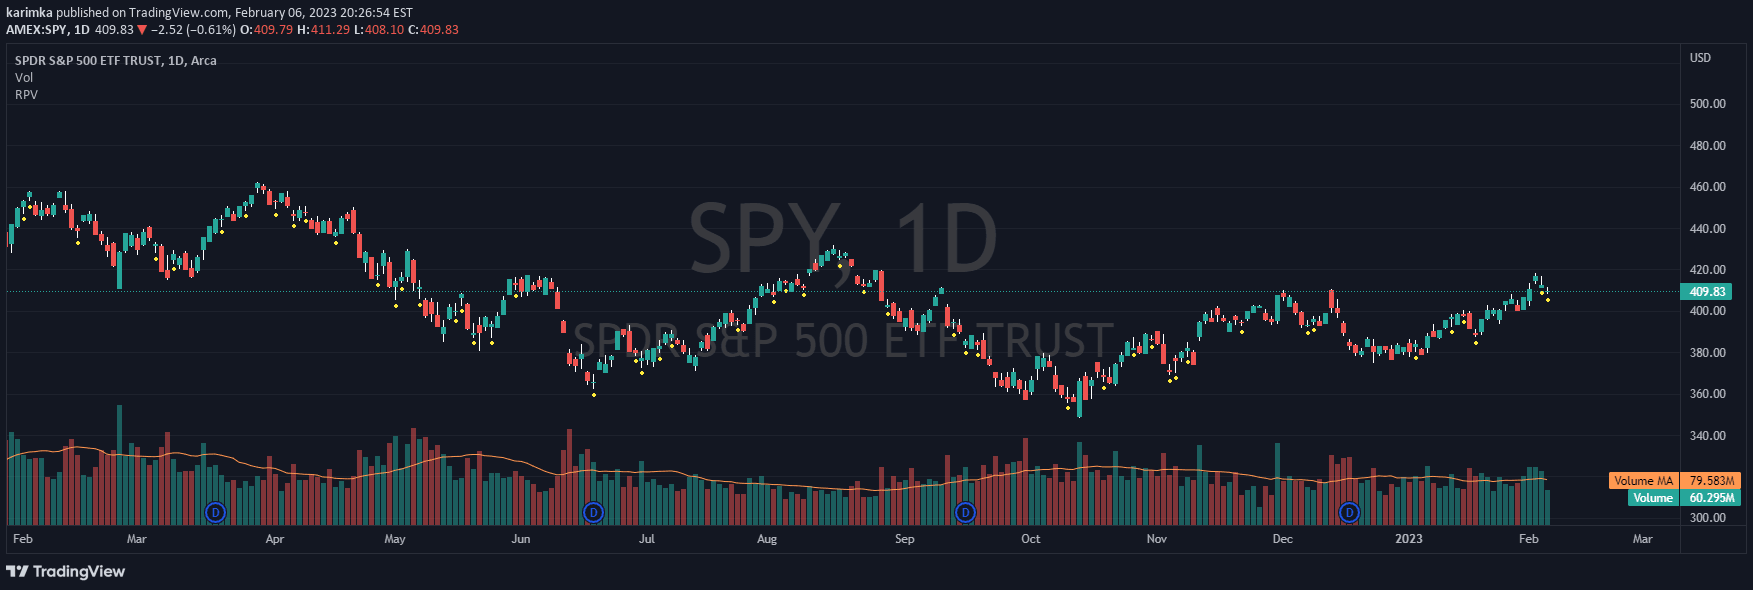
A custom volume-to-price ratio indicator that identifies high liquidity zones and market resistance by analyzing volume dynamics and exponential moving averages.
Explore complementary indicator rolesHow it works
The VR1 DEMA Liquidity Identifier calculates the ratio between volume and price range, using exponential moving averages to smooth and analyze market liquidity. It applies two primary computational methods: first, tracking the relationship between fast and slow EMAs derived from the volume-to-price ratio, and second, comparing current bar volume against a short-term volume moving average.
The indicator generates visual signals through color-coded EMAs and background shading, with specific conditions determining market liquidity. When the volume-to-price ratio exceeds a predefined multiplier and actual trading volume surpasses a threshold, the background changes color, signaling potential high-liquidity market conditions.
Why it may be useful
Traders benefit from this indicator by gaining deeper insights into market liquidity and potential price movement resistance. By combining volume analysis with price range metrics, the tool provides a more nuanced understanding of market dynamics that traditional volume indicators might miss.
The sophisticated filtering mechanism helps traders identify moments of significant market activity, potentially revealing hidden trading opportunities. Its customizable parameters allow adaptation to different trading styles and market conditions, making it a versatile tool for understanding underlying market strength and potential trend reversals.
When to explore it
The VR1 DEMA Liquidity Identifier is most effective in markets with significant volume fluctuations and during periods of potential trend transitions. It works exceptionally well in identifying consolidation zones, potential breakout points, and areas of strong market resistance where price movement might stall or reverse.
Traders should apply this indicator in more liquid markets like forex, major stock indices, and high-volume cryptocurrency pairs. It is particularly useful during key market sessions, such as overlap periods between different global trading centers, where volume and liquidity tend to be more dynamic and pronounced.
Keep exploring
What we’ve verified
Access, alerts and repainting behaviour have not been independently verified for this indicator. Check the creator’s current publication and settings.
General descriptions and classifications are recovered research. Verified details above identify the specific checks we have completed. Check the creator’s current publication for later changes.